seasonality report: what it measures and how traders use it
the seasonality report on edgeful calculates monthly and weekly seasonality patterns from historical price data by computing performance percentages for each month and each week of the year. it extracts close prices, resamples to monthly and weekly intervals, and aggregates by calendar month and ISO week.
you get average performance grouped by month and by week number, so you can see seasonal tendencies over time.
this is one of the 150+ reports available on the edgeful platform. here's how it works, what the data shows, and how traders use it.
table of contents
- what the seasonality report measures
- how the calculation works
- how traders use seasonality data
- combining seasonality with other reports
- key takeaways
what the seasonality report measures
the seasonality report calculates monthly and weekly seasonality patterns from historical price data by computing performance percentages for each month and each week of the year. it extracts close prices, resamples to monthly and weekly intervals, and aggregates by calendar month and ISO week.
the report is available for futures, stocks, ETFs, forex, and crypto. you can filter by ticker, lookback period (3 or 5 years), and timeframe (monthly or weekly).
how the calculation works
the seasonality report aggregates historical performance by calendar period.
- the report calculates returns for each month or week across the lookback period
- it averages those returns to produce expected performance for each calendar slot
- months or weeks with consistent historical direction stand out as seasonal patterns
- 3-year and 5-year lookbacks give different views — 3-year captures recent regime, 5-year smooths noise
- this gives you a statistical view of which calendar periods have historically been bullish or bearish
how traders use seasonality data
- building directional bias for the upcoming month based on historical tendencies
- timing swing entries to align with historically favorable weeks
- avoiding counter-seasonal trades during strong bullish or bearish periods
- pairing with performance trends for a longer historical view
- risk management by knowing which months show the most balanced (low edge) outcomes
the data doesn't tell you to trade. the seasonality report tells you the historical performance of the setup in front of you. what you do with that information is your decision.
results require customization, time, and effort. the numbers change depending on your ticker, session, and lookback period. always check the data for your specific conditions.
combining seasonality with other reports
the seasonality report works best when combined with other edgeful reports for confluence:
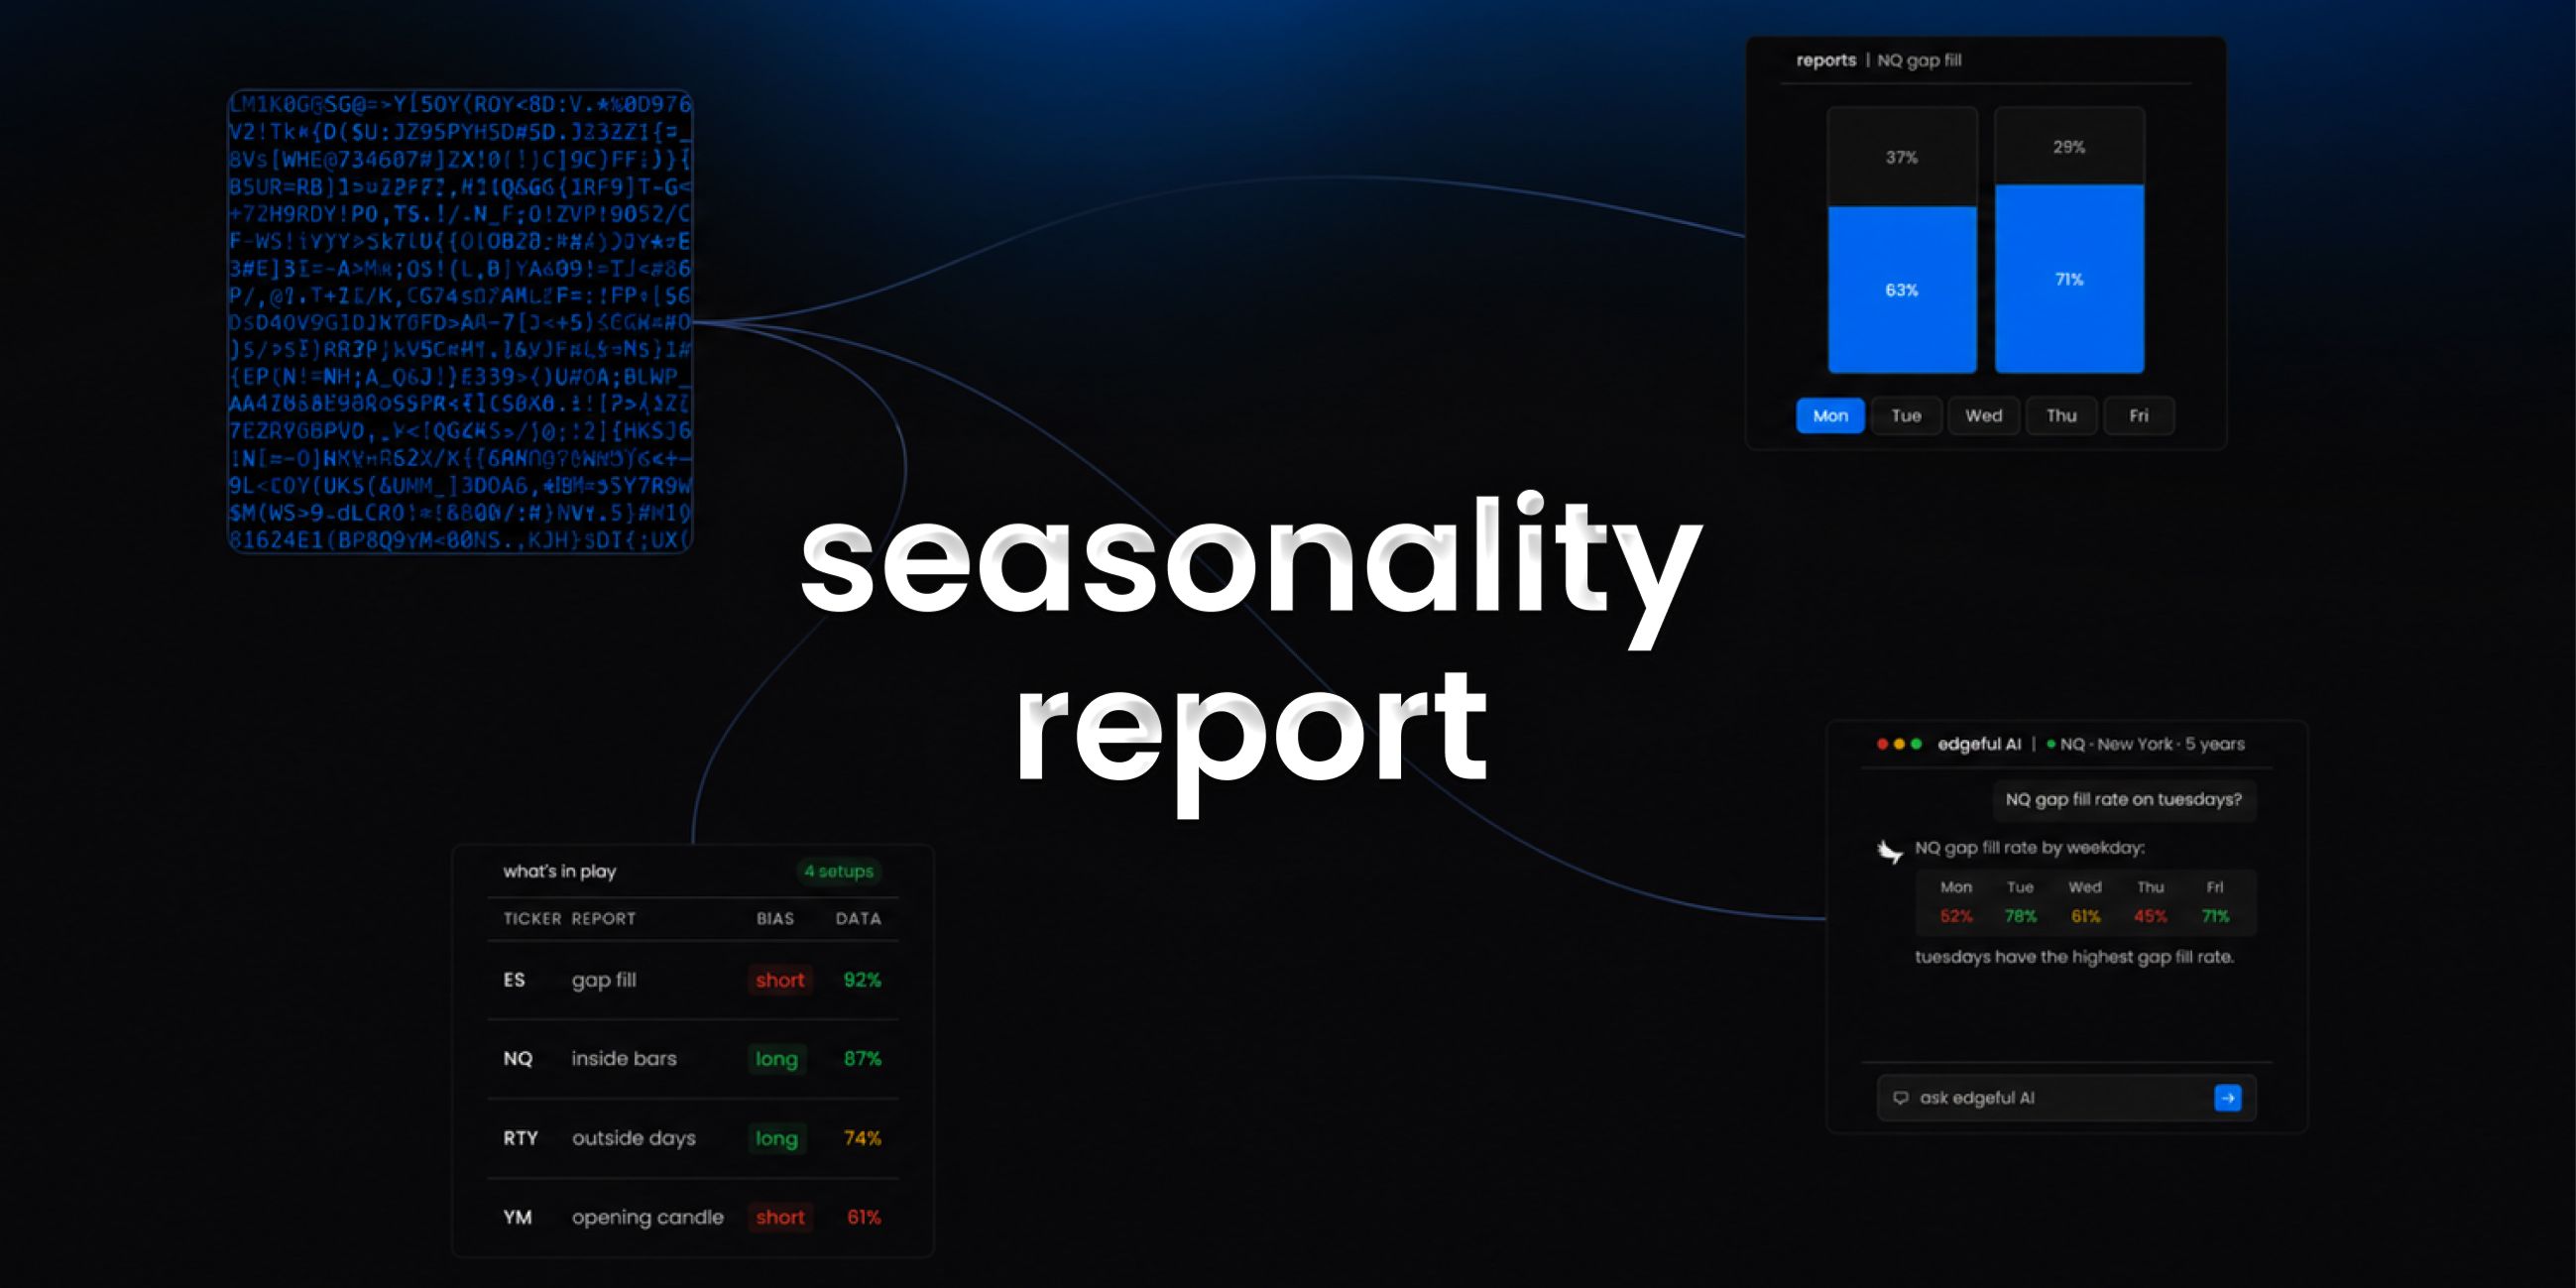
- use the what's in play dashboard to see seasonality data alongside your other favorite reports in one view
- the screener lets you scan up to 49 tickers for seasonality setups across 4 reports simultaneously
- edgeful AI can analyze seasonality data alongside other reports and find patterns you'd never spot manually
key takeaways
- the edgeful seasonality report measures average monthly and weekly performance over the last 3 or 5 years
- available for futures, stocks, ETFs, forex, and crypto with ticker and lookback filtering
- two timeframes: monthly and weekly
- part of the 150+ reports included in the edgeful essential plan ($49/month or $39/month annual)
- works best when combined with other reports using what's in play, the screener, or edgeful AI
trading involves risk. past performance and historical data do not guarantee future results. the statistics referenced in this post are based on historical data and may not reflect future market conditions. always trade with proper risk management.