previous week's range report: what it measures and how traders use it
the previous week's range report on edgeful analyzes weekly price action to determine how the current week interacts with the previous week's high and low. it processes historical OHLC data resampled to weekly intervals and tracks whether the current week breaks above the previous high, below the previous low, both, or stays inside.
you get directional bias statistics for weeks where both levels get touched.
this is one of the 150+ reports available on the edgeful platform. here's how it works, what the data shows, and how traders use it.
table of contents
- what the previous week's range report measures
- how the calculation works
- available subreports
- how traders use previous week's range data
- combining previous week's range with other reports
- key takeaways
what the previous week's range report measures
the previous week's range report analyzes weekly price action to determine how the current week interacts with the previous week's high and low. it processes historical OHLC data resampled to weekly intervals and tracks whether the current week breaks above the previous high, below the previous low, both, or stays inside.
the report is available for futures, stocks, ETFs, forex, and crypto. you can filter by ticker, session (NY, London, Asian, full globex, or custom), and lookback period (1 month to 5+ years).
how the calculation works
the previous week's range report uses last week's high and low as reference levels for the current week.
- the report establishes the high and low of the previous trading week
- during the current week, it monitors for breaks above last week's high or below last week's low
- each week is categorized as single break, double break, or no break
- the order of breaks is also tracked for double-break weeks
- this gives you a statistical breakdown of how often last week's range gets violated and in which direction
available subreports
the previous week's range report has 2 subreports for deeper analysis:
by open. categorizes weeks based on whether the current week opens above or below the midpoint of last week's range. measures how that opening location affects break direction and frequency.
by outside close. tracks whether price closes outside last week's range after breaking it, separating clean breakouts from false breakouts that fade back inside.
how traders use previous week's range data
- identifying when single breaks are most common (don't expect a double break if data shows otherwise)
- using last week's high/low as weekly target zones
- building directional bias for the week based on which side breaks first
- risk management by knowing the historical frequency of no-break weeks
- timing entries on monday/tuesday when most breakouts of the previous week's range occur
the data doesn't tell you to trade. the previous week's range report tells you the historical performance of the setup in front of you. what you do with that information is your decision.
results require customization, time, and effort. the numbers change depending on your ticker, session, and lookback period. always check the data for your specific conditions.
combining previous week's range with other reports
the previous week's range report works best when combined with other edgeful reports for confluence:
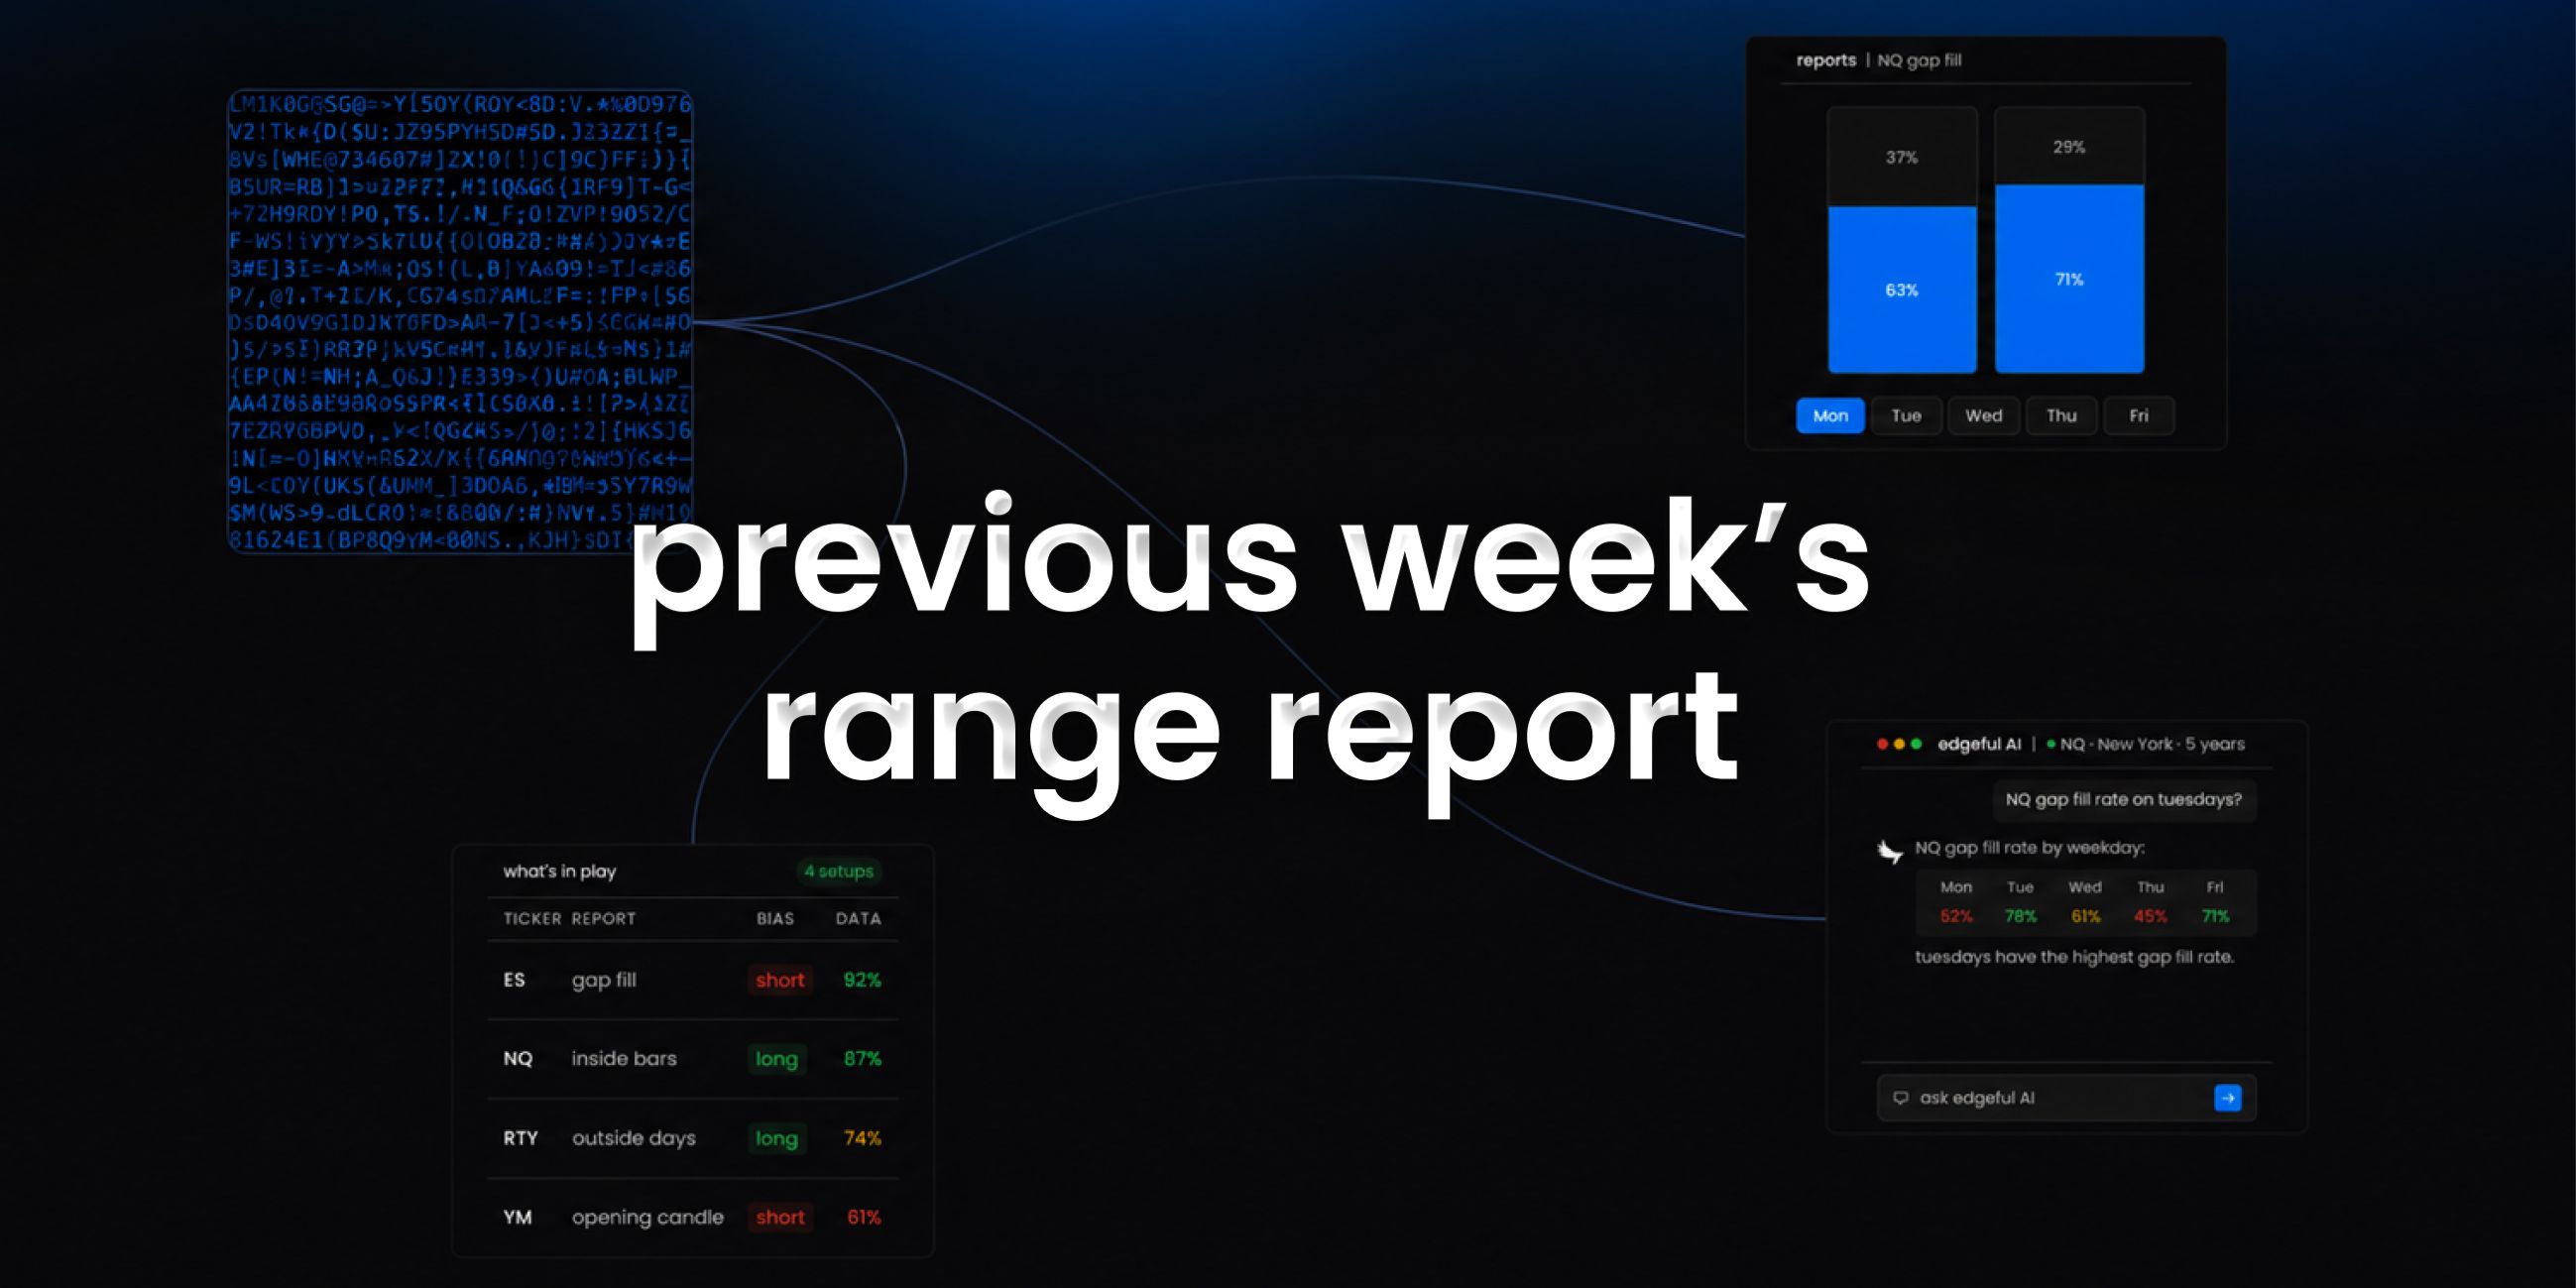
- use the what's in play dashboard to see previous week's range data alongside your other favorite reports in one view
- the screener lets you scan up to 49 tickers for previous week's range setups across 4 reports simultaneously
- edgeful AI can analyze previous week's range data alongside other reports and find patterns you'd never spot manually
key takeaways
- the edgeful previous week's range report measures how often this week's price action breaks last week's high or low
- available for futures, stocks, ETFs, forex, and crypto with full session, ticker, and date range filtering
- 2 subreports available: by open, by outside close
- part of the 150+ reports included in the edgeful essential plan ($49/month or $39/month annual)
- works best when combined with other reports using what's in play, the screener, or edgeful AI
trading involves risk. past performance and historical data do not guarantee future results. the statistics referenced in this post are based on historical data and may not reflect future market conditions. always trade with proper risk management.