previous day's range report: what it measures and how traders use it
the previous day's range report on edgeful analyzes when current day prices break above the previous day's high or below the previous day's low, filtered by previous day range size.
you get statistics for high and low breaks including green versus red closing performance based on the close relative to the previous close or current open.
this is one of the 150+ reports available on the edgeful platform. here's how it works, what the data shows, and how traders use it.
table of contents
- what the previous days range report measures
- how the calculation works
- available subreports
- how traders use previous days range data
- combining previous days range with other reports
- key takeaways
what the previous days range report measures
the previous day's range report analyzes when current day prices break above the previous day's high or below the previous day's low, filtered by previous day range size.
the report is available for futures, stocks, ETFs, forex, and crypto. you can filter by ticker, session (NY, London, Asian, full globex, or custom), and lookback period (1 month to 5+ years).
how the calculation works
the previous day's range report analyzes how today's price action relates to yesterday's high and low.
- the report measures the previous day's range (high minus low) and uses it as a reference
- it tracks whether today's price breaks above yesterday's high, below yesterday's low, or stays within the range
- when a break occurs, it records whether the day closes green or red
- results can be filtered by the size of the previous day's range to see how narrow vs. wide ranges affect breakout behavior
- percentages show breakout frequency and directional outcomes for each scenario
available subreports
the previous days range report has 4 subreports for deeper analysis:
by levels. analyzes how often price breaks above or below the previous day's high and low, measuring the extent of these breaks in multiples of the previous day's range.
by outside close. analyzes historical price data to track how often the current day breaks above the previous day high or below the previous day low, and whether the close is above or below the broken level. Filters data based on previous day range size categories and calculates performance statistics for both high and low breakouts with close performance classification.
by prev close. analyzes the performance outcomes when current day prices break above previous day high or below previous day low levels, categorized by whether the previous day closed green or red. Calculates success rates based on whether current day closes above the specified performance denominator (previous close or current open). Includes filtering by previous day range size categories from 0-6+ percent ranges.
by weekday. analyzes when current day high/low prices break previous day high/low levels, filtering by previous day range percentage size and grouping results by weekday. Tracks performance outcomes based on whether the current day closes green or red relative to the performance denominator (previous close or current open).
how traders use previous days range data
- identifying breakout patterns when price moves beyond previous day trading range boundaries
- evaluating success rates of previous day high and low breakouts for entry timing
- filtering setups based on previous day range size to focus on specific volatility conditions
- risk assessment using historical performance statistics of range break scenarios
- position sizing decisions based on probability of green versus red closes after range breaks
the data doesn't tell you to trade. the previous days range report tells you the historical performance of the setup in front of you. what you do with that information is your decision.
results require customization, time, and effort. the numbers change depending on your ticker, session, and lookback period. always check the data for your specific conditions.
combining previous days range with other reports
the previous days range report works best when combined with other edgeful reports for confluence:
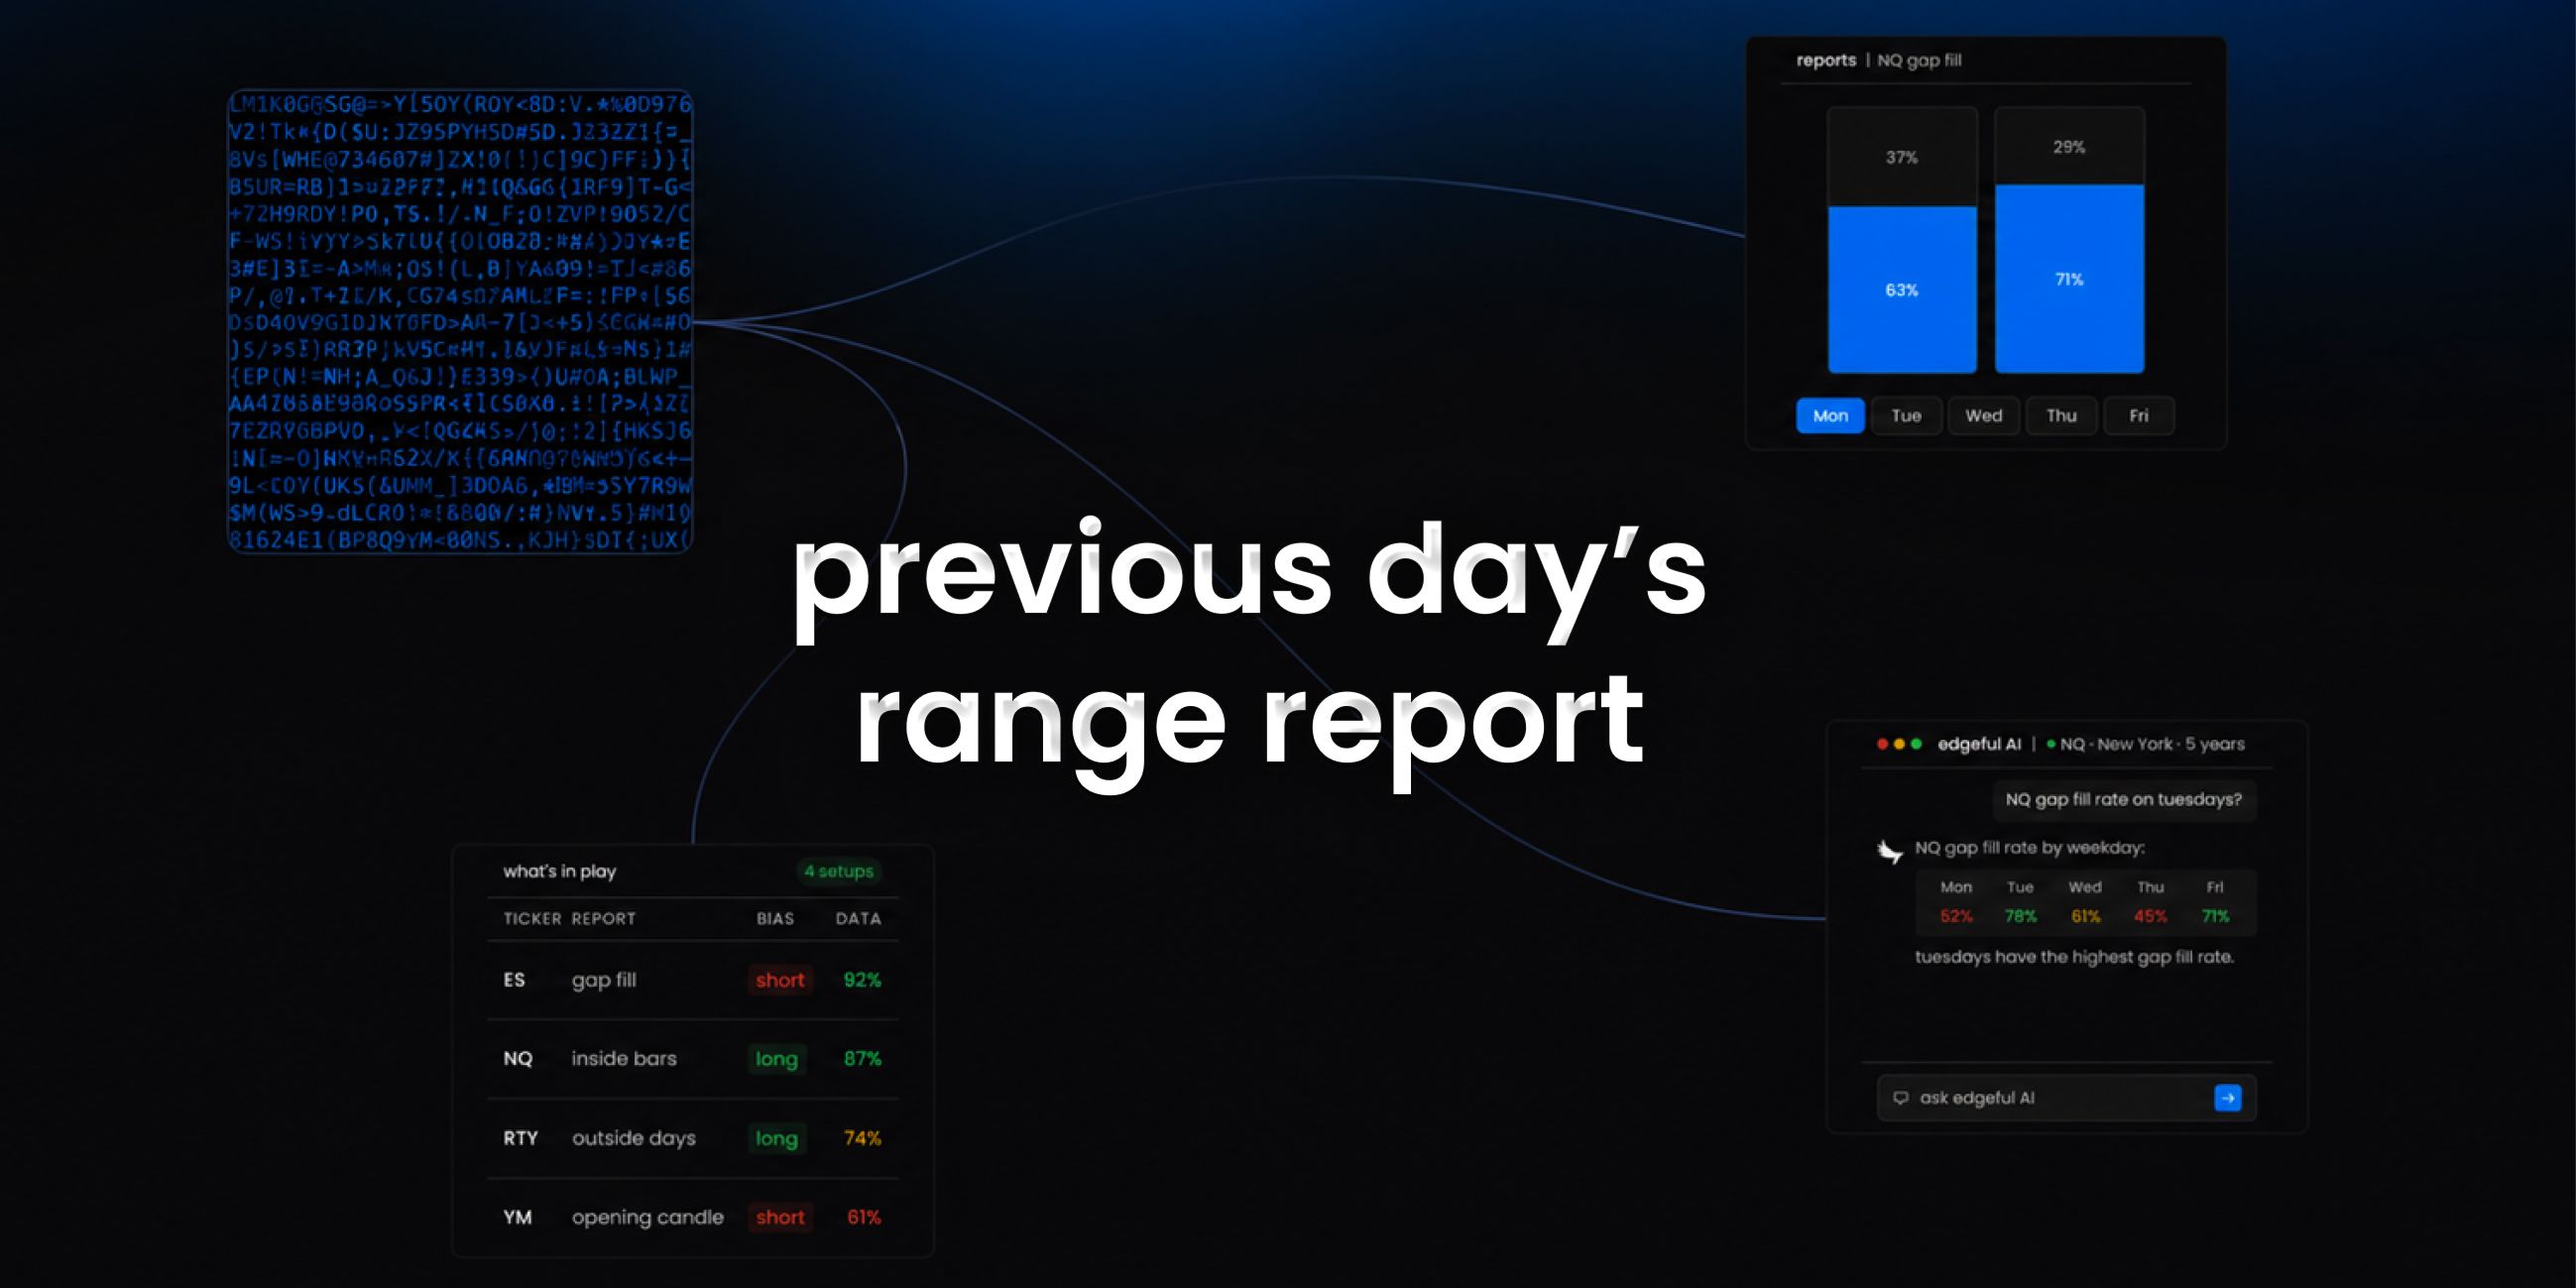
- use the what's in play dashboard to see previous days range data alongside your other favorite reports in one view
- the screener lets you scan up to 49 tickers for previous days range setups across 4 reports simultaneously
- edgeful AI can analyze previous days range data alongside other reports and find patterns you'd never spot manually
key takeaways
- the edgeful previous days range report measures analyzes when current day prices break above previous day high or below previous day low, filtered by previous day range size criteria.
- available for futures, stocks, ETFs, forex, and crypto with full session, ticker, and date range filtering
- 4 subreports available: by levels, by outside close, by prev close, by weekday
- part of the 150+ reports included in the edgeful essential plan ($49/month or $39/month annual)
- works best when combined with other reports using what's in play, the screener, or edgeful AI
trading involves risk. past performance and historical data do not guarantee future results. the statistics referenced in this post are based on historical data and may not reflect future market conditions. always trade with proper risk management.