power hour continuation report: what it measures and how traders use it
the power hour continuation report on edgeful analyzes the relationship between opening session candle color (green or red) and power hour performance using bucket and remaining session data. it calculates frequencies and percentages for green-to-green, green-to-red, red-to-green, and red-to-red continuation patterns using open and close comparisons.
you get a clean view of how often the opening session carries through to power hour.
this is one of the 150+ reports available on the edgeful platform. here's how it works, what the data shows, and how traders use it.
table of contents
- what the power hour continuation report measures
- how the calculation works
- available subreports
- how traders use power hour continuation data
- combining power hour continuation with other reports
- key takeaways
what the power hour continuation report measures
the power hour continuation report analyzes the relationship between opening session candle color (green or red) and power hour performance using bucket and remaining session data. it calculates frequencies and percentages for green-to-green, green-to-red, red-to-green, and red-to-red continuation patterns using open and close comparisons.
the report is available for futures, stocks, ETFs, forex, and crypto. you can filter by ticker, session (NY, London, Asian, full globex, or custom), and lookback period (1 month to 5+ years).
how the calculation works
the power hour continuation report measures whether direction holds from the start of power hour to the close.
- the report identifies the open of the session and the start of power hour (e.g., 3:00 PM ET for NY by default, customizable)
- it calculates the session direction at the start of power hour (green or red)
- it then measures the daily close to determine if direction continued or reversed
- each day is classified as continuation (same color) or reversal (different color)
- this gives you a statistical breakdown of how often the late-day move continues into the close
available subreports
the power hour continuation report has 1 subreport for deeper analysis:
by weekday. breaks down continuation rates by day of the week. some weekdays show much stronger end-of-day continuation than others, which is essential filtering for late-day strategies.
how traders use power hour continuation data
- holding winning trades through power hour when continuation odds are high
- avoiding fade trades against an established direction in the final hour
- timing exits based on weekday patterns where reversals are more common
- pairing with opening candle continuation for full-session bias
- risk management by knowing when late-day chop is statistically more likely
the data doesn't tell you to trade. the power hour continuation report tells you the historical performance of the setup in front of you. what you do with that information is your decision.
results require customization, time, and effort. the numbers change depending on your ticker, session, and lookback period. always check the data for your specific conditions.
combining power hour continuation with other reports
the power hour continuation report works best when combined with other edgeful reports for confluence:
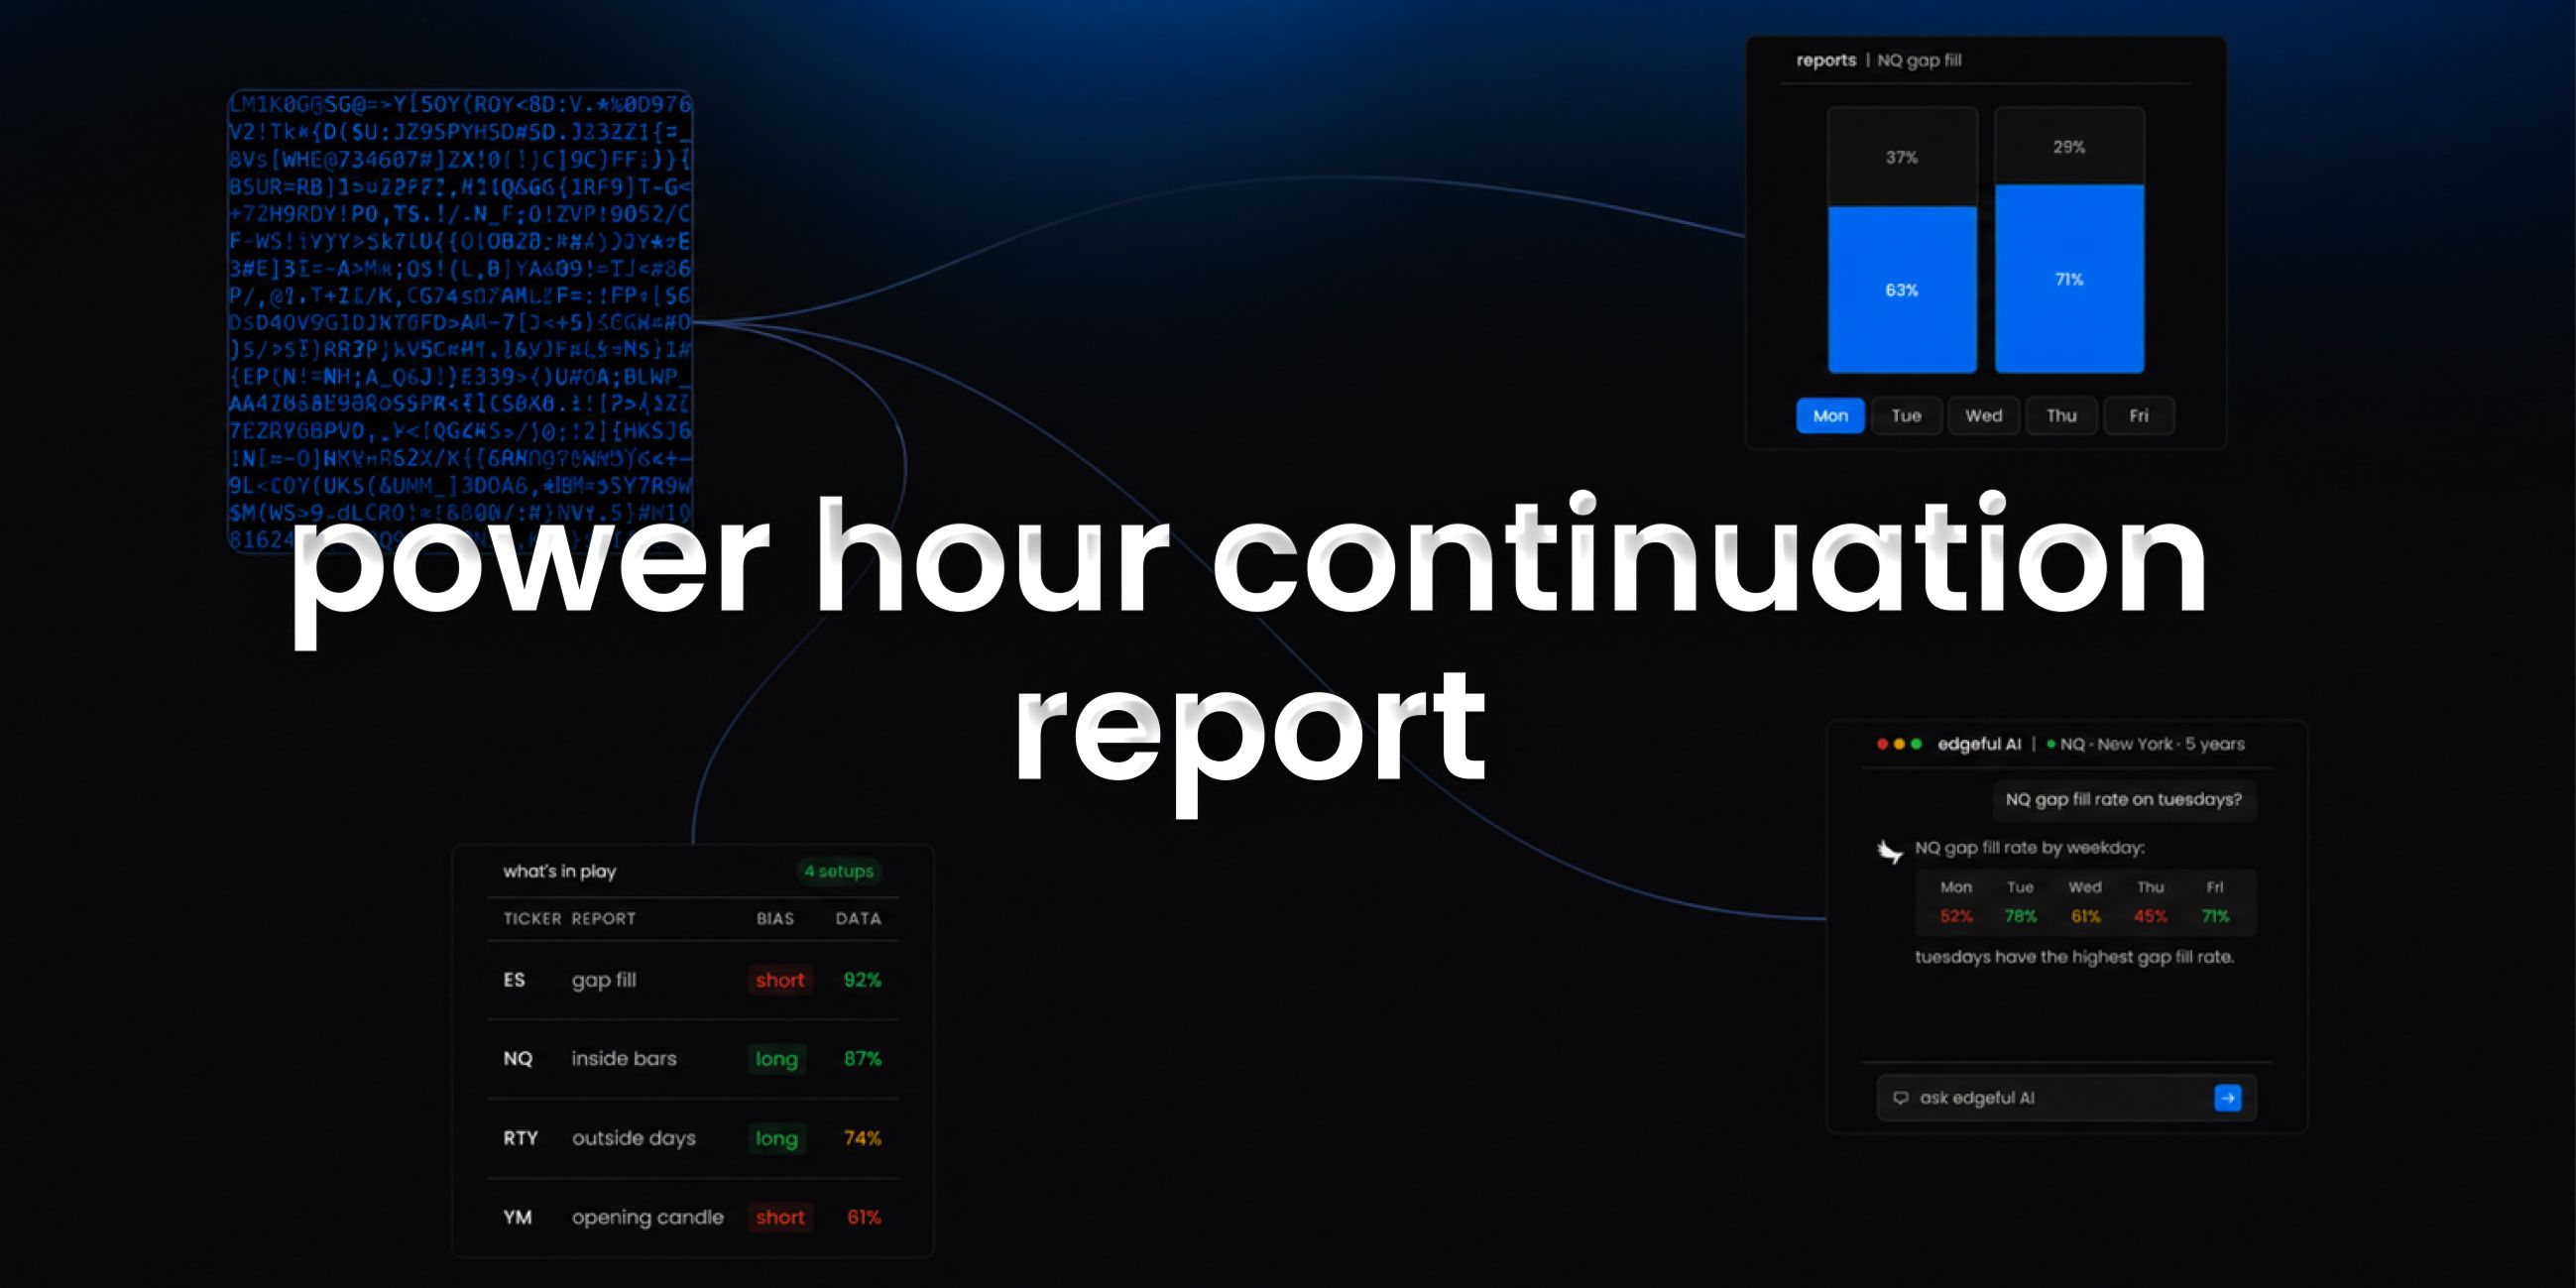
- use the what's in play dashboard to see power hour continuation data alongside your other favorite reports in one view
- the screener lets you scan up to 49 tickers for power hour continuation setups across 4 reports simultaneously
- edgeful AI can analyze power hour continuation data alongside other reports and find patterns you'd never spot manually
key takeaways
- the edgeful power hour continuation report measures how often session direction heading into power hour holds through the close
- available for futures, stocks, ETFs, forex, and crypto with full session, ticker, and date range filtering
- 1 subreport available: by weekday
- part of the 150+ reports included in the edgeful essential plan ($49/month or $39/month annual)
- works best when combined with other reports using what's in play, the screener, or edgeful AI
trading involves risk. past performance and historical data do not guarantee future results. the statistics referenced in this post are based on historical data and may not reflect future market conditions. always trade with proper risk management.