pivot points report: what it measures and how traders use it
the pivot points report on edgeful calculates standard pivot points using either traditional or Camarilla formulas from historical price data.
analyzes where price opens relative to pivot levels and tracks which levels price touches during each day. returns pivot level statistics, closing level distributions, and final day pivot calculations.
this is one of the 150+ reports available on the edgeful platform. here's how it works, what the data shows, and how traders use it.
table of contents
- what the pivot points report measures
- how the calculation works
- available subreports
- how traders use pivot points data
- combining pivot points with other reports
- key takeaways
what the pivot points report measures
the pivot points report calculates standard pivot points using either traditional or Camarilla formulas from historical price data.
it analyzes where price opens relative to those pivot levels and tracks which levels price touches throughout each day.
you get pivot level statistics, closing level distributions, and final day pivot calculations so you can see how price interacts with each level over time.
the report is available for futures, stocks, ETFs, forex, and crypto. you can filter by ticker, session (NY, London, Asian, full globex, or custom), and lookback period (1 month to 5+ years).
how the calculation works
the pivot points report calculates standard pivot levels from the previous day's price data and tracks how price interacts with them.
- the report uses the previous day's high, low, and close to calculate the pivot point (PP) and support/resistance levels (S1-S3, R1-R3)
- both traditional and Camarilla formulas are supported
- it tracks where price opens relative to pivot levels and which levels price touches during the day
- closing level distributions show where price finishes most often relative to pivot levels
- this gives you a statistical framework for setting intraday targets and stops based on pivot math
available subreports
the pivot points report has 2 subreports for deeper analysis:
- by prev candle. calculates pivot point levels using previous day's high, low, and close prices, then analyzes how current day's price action interacts with these levels based on whether the previous candle was green or red. Supports both traditional and Camarilla pivot calculation methods and tracks success rates of reaching each pivot level.
- by weekday. calculates pivot point statistics for each weekday using either traditional or Camarilla formulas. Analyzes historical price data to determine how often price hits each pivot level (PP, R1-R3, S1-S3) based on opening level ranges, tracking both touch percentages and closing level distributions by day of week.
how traders use pivot points data
- identifying support and resistance levels for intraday trading based on previous day price action
- setting profit targets at calculated resistance levels R1, R2, R3 for long positions
- placing stop losses below support levels S1, S2, S3 for risk management
- analyzing probability of price reaching specific pivot levels based on opening gap location
- choosing between traditional and Camarilla formulas based on market volatility preferences
the data doesn't tell you to trade. the pivot points report tells you the historical performance of the setup in front of you. what you do with that information is your decision.
results require customization, time, and effort. the numbers change depending on your ticker, session, and lookback period. always check the data for your specific conditions.
combining pivot points with other reports
the pivot points report works best when combined with other edgeful reports for confluence:
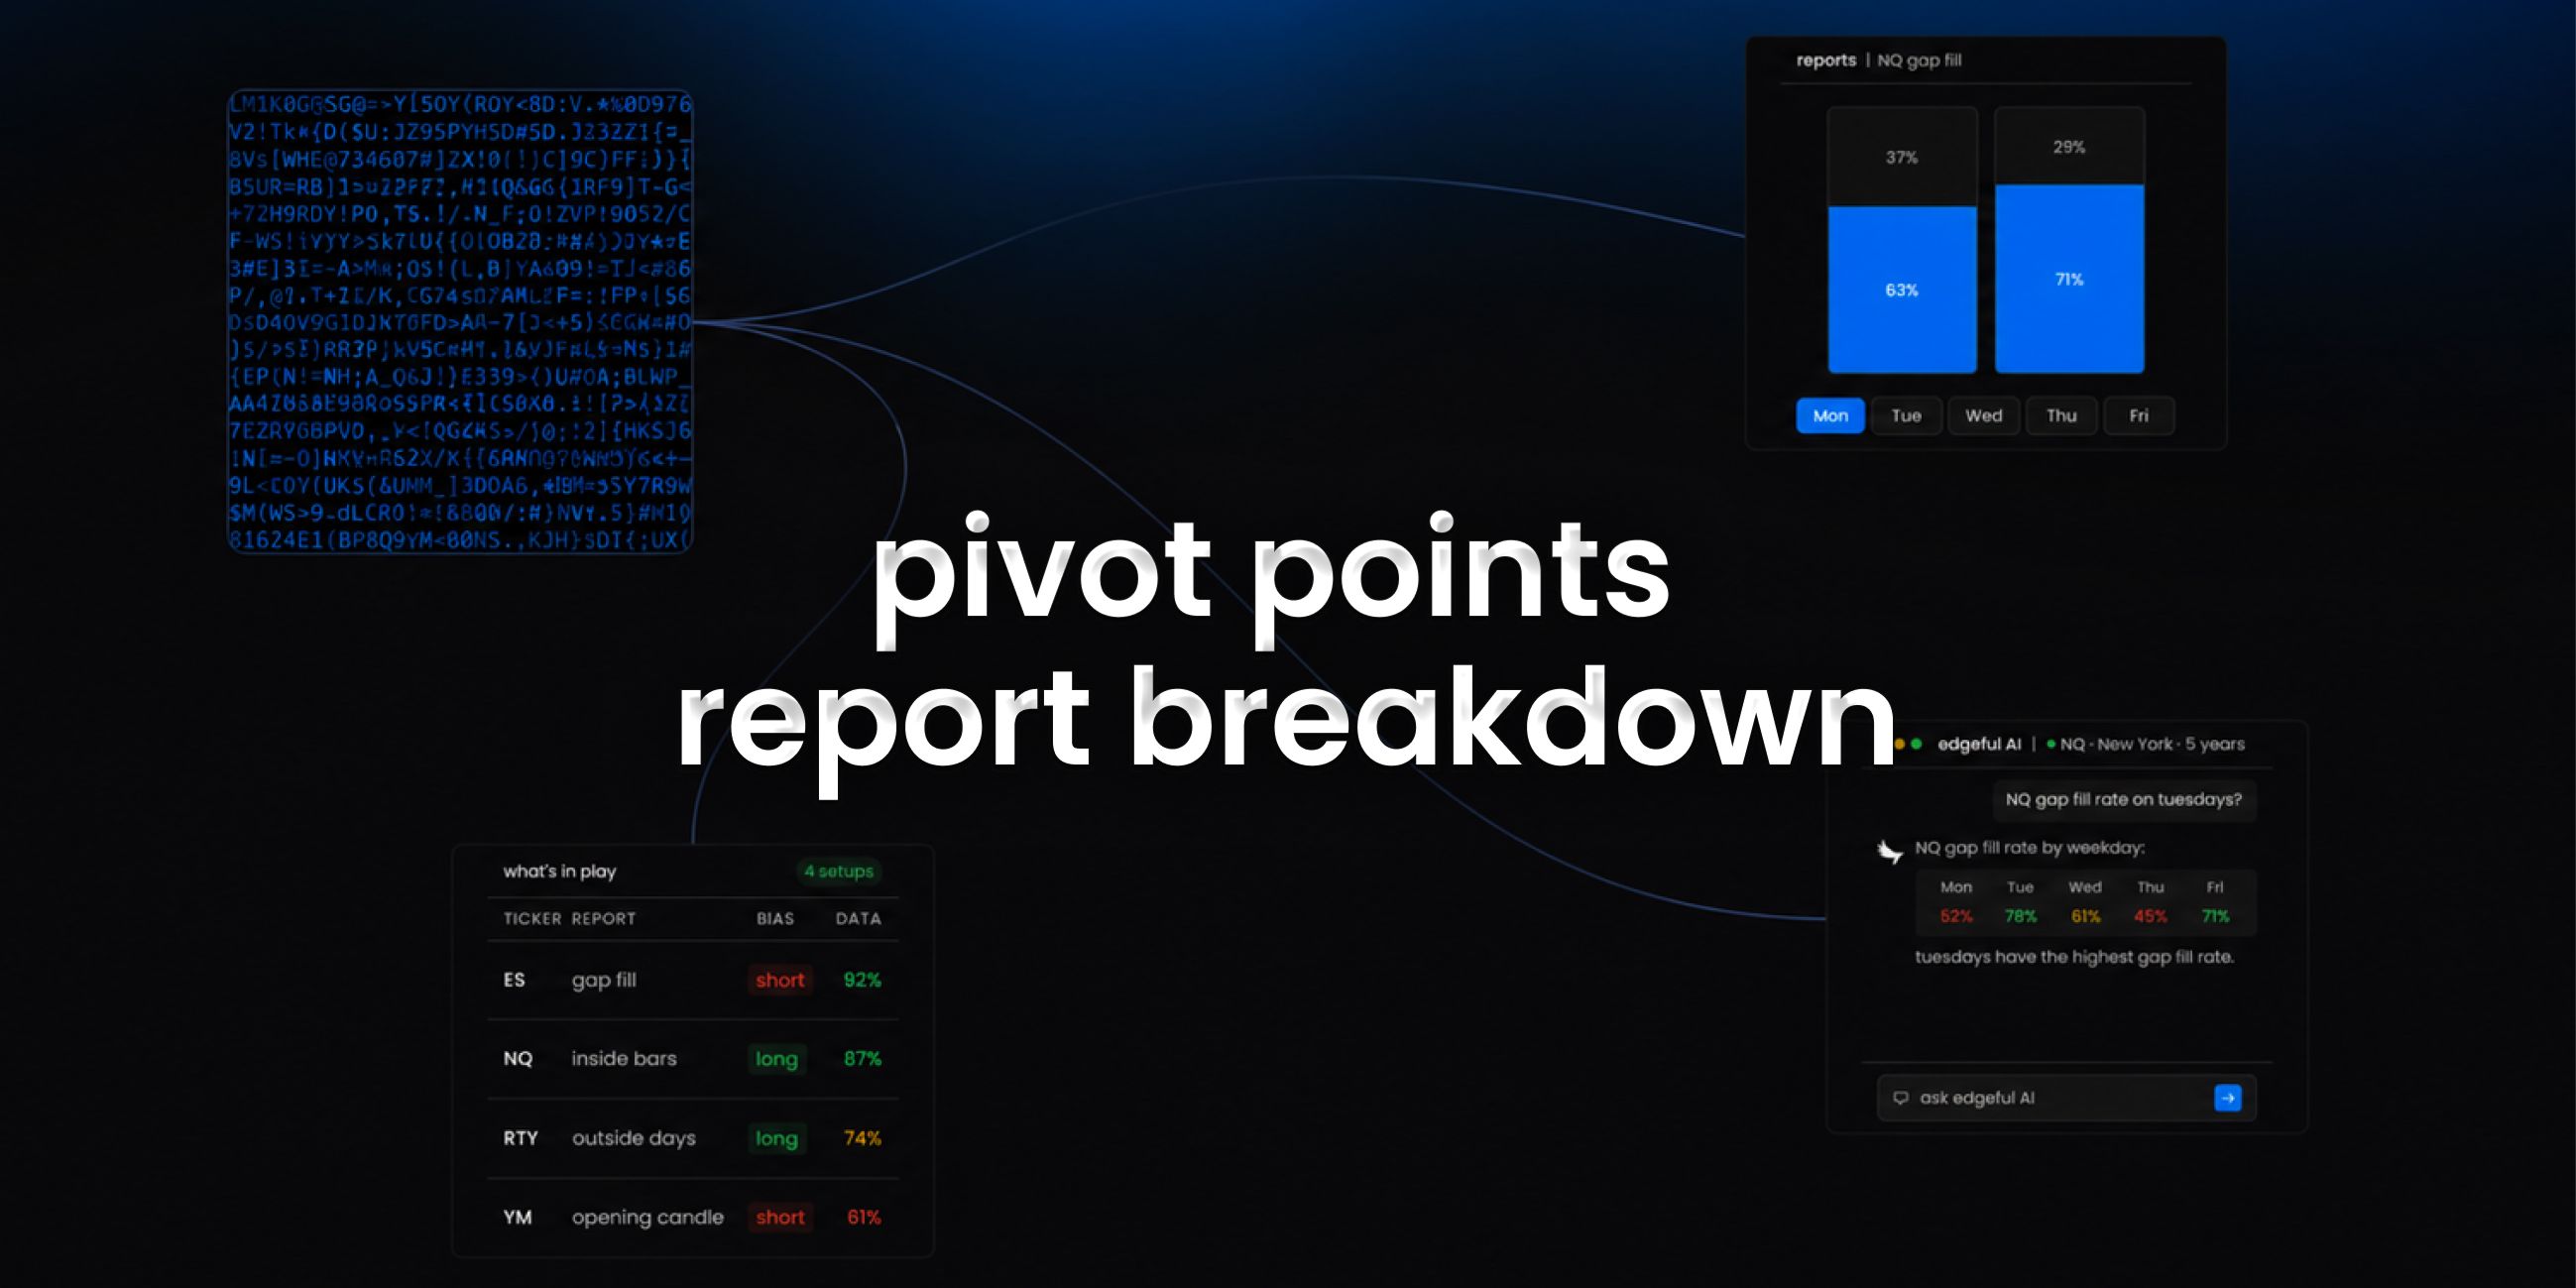
- use the what's in play dashboard to see pivot points data alongside your other favorite reports in one view
- the screener lets you scan up to 49 tickers for pivot points setups across 4 reports simultaneously
- edgeful AI can analyze pivot points data alongside other reports and find patterns you'd never spot manually
key takeaways
- the edgeful pivot points report measures calculates standard pivot points using either traditional or camarilla formulas from historical price data.
- available for futures, stocks, ETFs, forex, and crypto with full session, ticker, and date range filtering
- 2 subreports available: by prev candle, by weekday
- part of the 150+ reports included in the edgeful essential plan ($49/month or $39/month annual)
- works best when combined with other reports using what's in play, the screener, or edgeful AI
trading involves risk. past performance and historical data do not guarantee future results. the statistics referenced in this post are based on historical data and may not reflect future market conditions. always trade with proper risk management.