opening stats report: what it measures and how traders use it
the opening stats report on edgeful analyzes where each day's open falls relative to the previous day's high-low range. it calculates statistics for three categories: opens above the previous high, opens inside the previous range, and opens below the previous low.
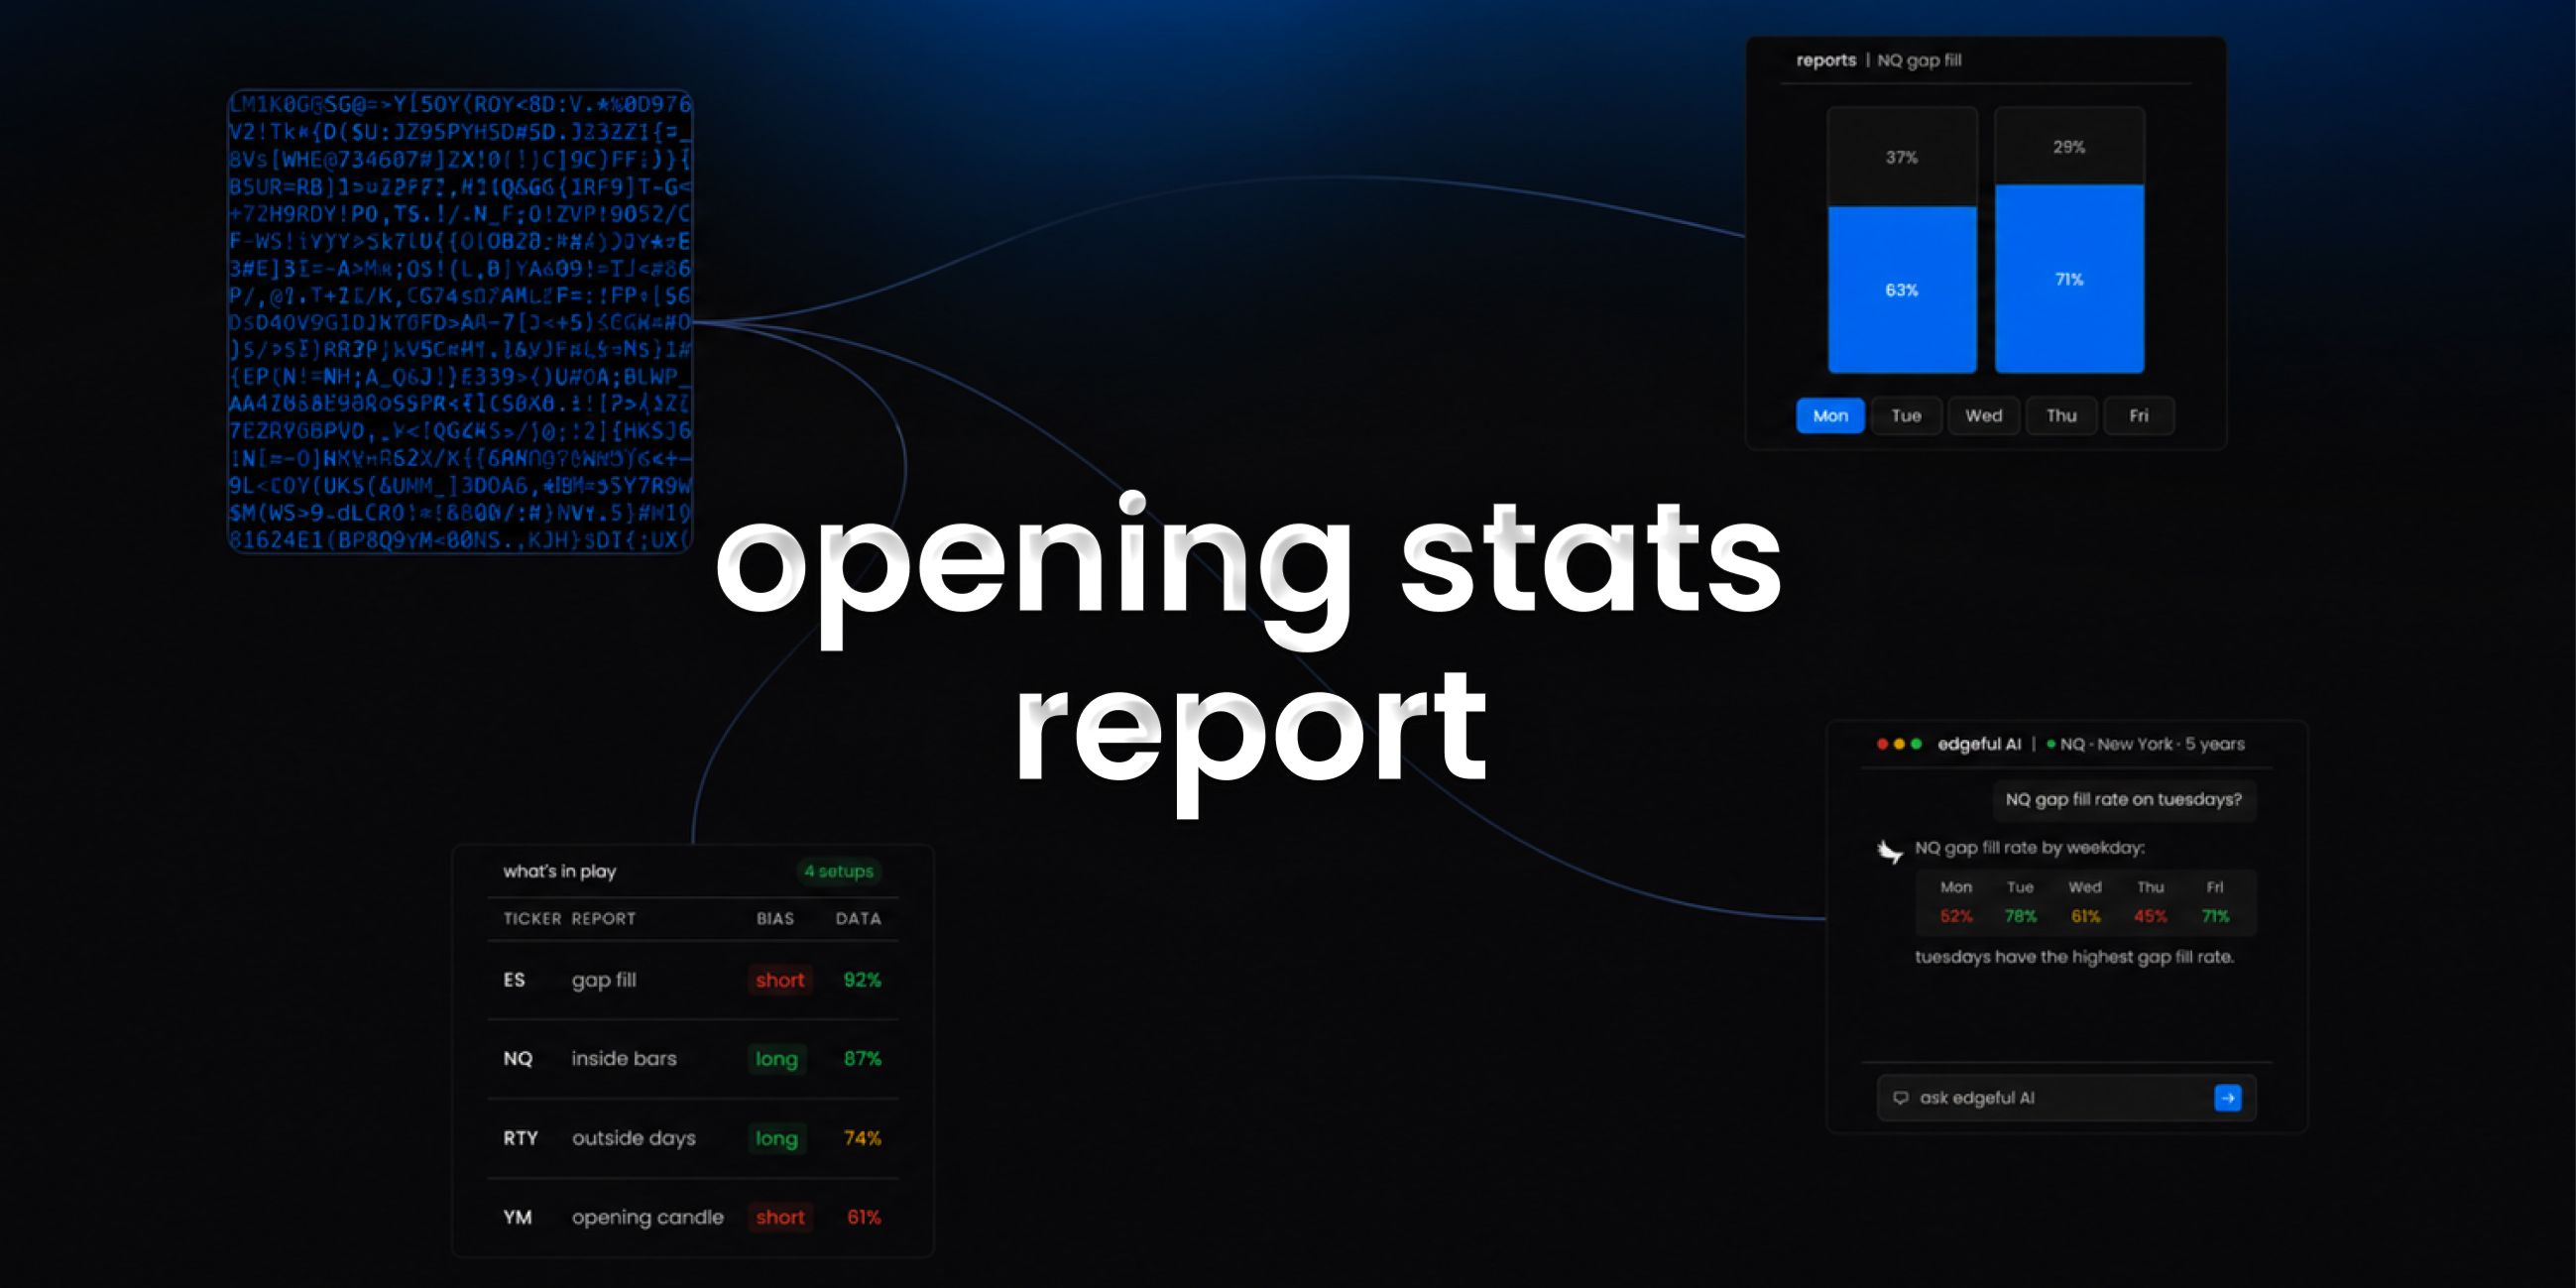
you get percentage distributions and detailed daily classifications with date stamps.
this is one of the 150+ reports available on the edgeful platform. here's how it works, what the data shows, and how traders use it.
table of contents
- what the opening stats report measures
- how the calculation works
- how traders use opening stats data
- combining opening stats with other reports
- key takeaways
what the opening stats report measures
the opening stats report analyzes where each day's open falls relative to the previous day's high-low range. it calculates statistics for three categories: opens above the previous high, opens inside the previous range, and opens below the previous low.
the report is available for futures, stocks, ETFs, forex, and crypto. you can filter by ticker and session (NY, London, Asian, full globex, or custom).
how the calculation works
the opening stats report compares today's open to a set of reference levels.
- the report pulls the latest opening price for the chosen session
- it compares that open to yesterday's high, yesterday's low, yesterday's close, and the midnight open
- each comparison is classified (above, below, inside the prior range, etc.)
- the result is a quick overview of the day's opening location
- this gives you a snapshot of which other reports — gap fill, outside days, ICT opening retracement — are most relevant for the current session
how traders use opening stats data
- a quick pre-market reference to identify the day's setup
- routing into the right deeper reports based on opening location
- confirming whether today is a gap day, outside day, or inside-the-range day at a glance
- pairing with the what's in play dashboard for full pre-market context
- risk management by recognizing the day's structural starting point
the data doesn't tell you to trade. the opening stats report tells you the historical performance of the setup in front of you. what you do with that information is your decision.
results require customization, time, and effort. the numbers change depending on your ticker, session, and lookback period. always check the data for your specific conditions.
combining opening stats with other reports
the opening stats report works best when combined with other edgeful reports for confluence:
- use the what's in play dashboard to see opening stats alongside your other favorite reports in one view
- the screener lets you scan up to 49 tickers for opening stats setups across 4 reports simultaneously
- edgeful AI can analyze opening stats alongside other reports and find patterns you'd never spot manually
key takeaways
- the edgeful opening stats report shows where today's price opened relative to yesterday's high, low, close, and midnight open
- available for futures, stocks, ETFs, forex, and crypto with ticker and session filtering
- designed as a fast pre-market reference to route into deeper reports
- part of the 150+ reports included in the edgeful essential plan ($49/month or $39/month annual)
- works best when combined with other reports using what's in play, the screener, or edgeful AI
trading involves risk. past performance and historical data do not guarantee future results. the statistics referenced in this post are based on historical data and may not reflect future market conditions. always trade with proper risk management.