opening range breakout report: what it measures and how traders use it
the opening range breakout (ORB) report on edgeful analyzes price breakouts and breakdowns from opening range levels by grouping historical data by date and comparing subsequent price movements against the high and low established during the opening range period. Tracks breakout counts, breakdown counts, double breaks, and no-break occurrences with detailed breakout information for each trading day.
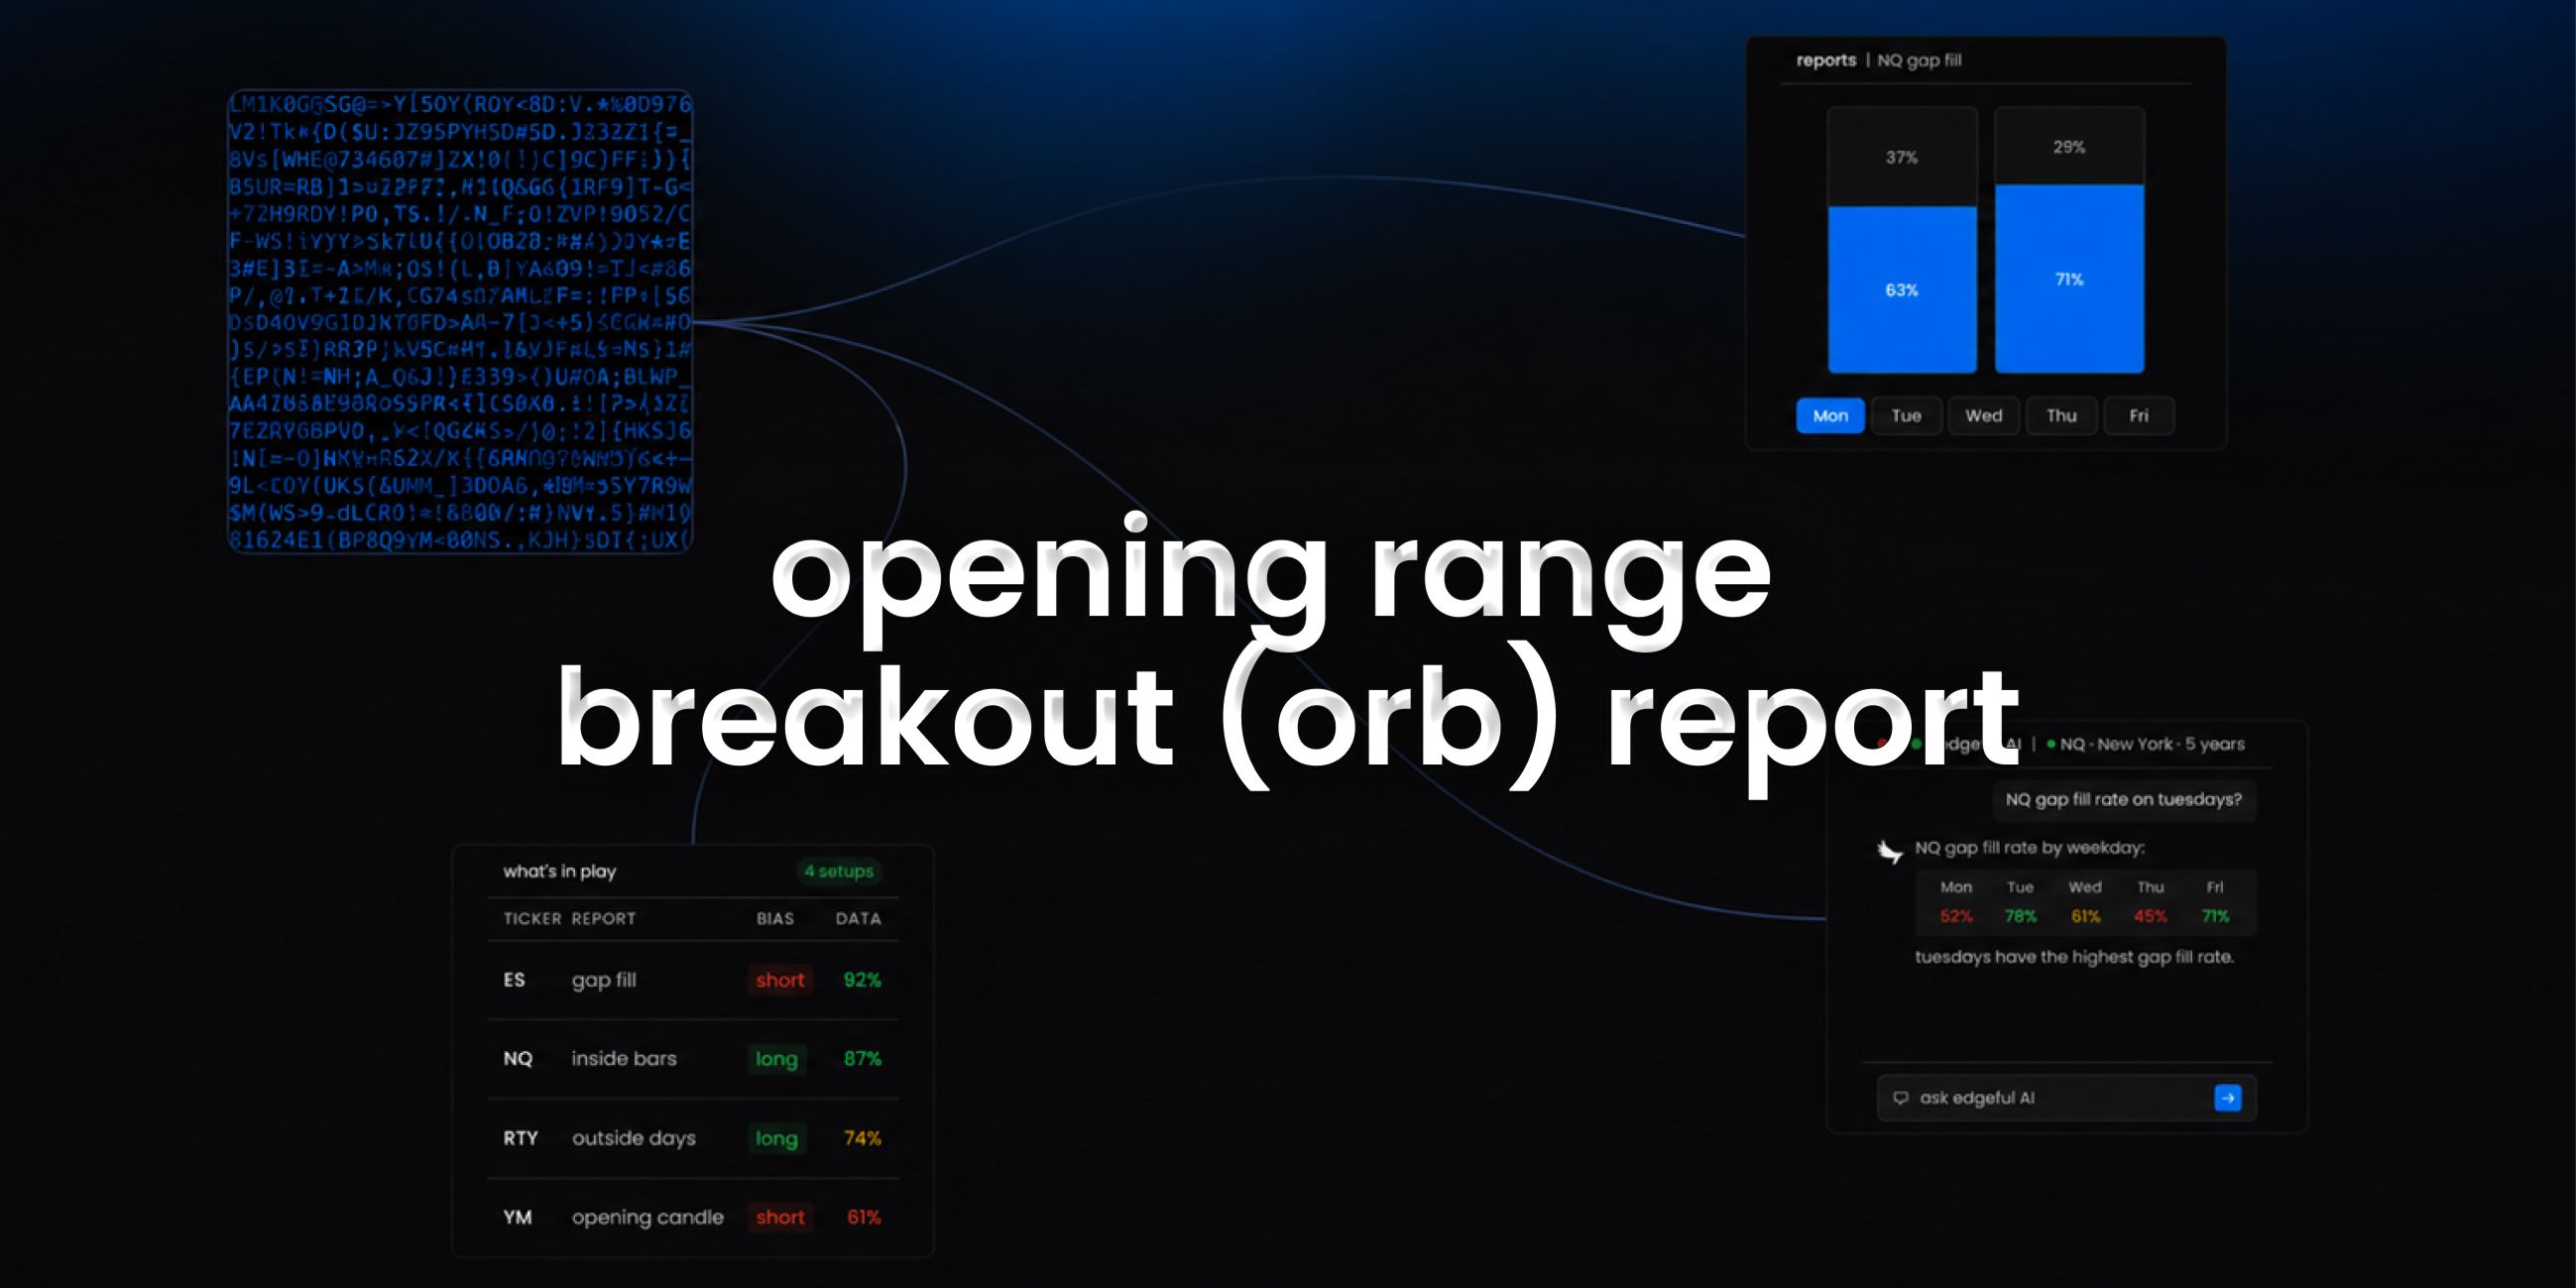
this is one of the 150+ reports available on the edgeful platform. here's how it works, what the data shows, and how traders use it.
table of contents
- what the opening range breakout report measures
- how the calculation works
- available subreports
- how traders use opening range breakout data
- combining opening range breakout with other reports
- key takeaways
what the opening range breakout report measures
Analyzes price breakouts and breakdowns from opening range levels by grouping historical data by date and comparing subsequent price movements against the high and low established during the opening range period. Tracks breakout counts, breakdown counts, double breaks, and no-break occurrences with detailed breakout information for each trading day.
the report is available for futures, stocks, ETFs, forex, and crypto. you can filter by ticker, session (NY, London, Asian, full globex, or custom), and lookback period (1 month to 5+ years).
how the calculation works
the opening range breakout report establishes the high and low during a configurable opening range period, then tracks what happens after.
- the report identifies the highest and lowest prices during the opening range (configurable timeframe)
- it monitors subsequent price action for breaks above the opening range high or below the opening range low
- each day is classified as: breakout, breakdown, double break, or no break
- you can choose whether breakouts are determined by close price or wick (high/low) touches
- percentages are calculated for each outcome across your selected date range
available subreports
the opening range breakout report has 7 subreports for deeper analysis:
- by close. analyzes where the last candle closes relative to opening range boundaries and session extremes after opening range breakouts.
- by levels. analyzes opening range breakout patterns by measuring how far price extends beyond the opening range at predefined levels.
- by performance. analyzes opening range breakout performance by measuring how far price extends after breaking above or below the opening range high/low before breaking back. Groups historical data by date, calculates opening range boundaries from the first N candles, identifies the first breakout direction, and measures maximum extension until breakback occurs. Returns performance statistics including average and maximum breakout percentages.
- by retracement. analyzes opening range breakouts and subsequent retracement patterns by measuring how often price retraces to specific percentage levels of the opening range after an initial breakout or breakdown occurs. Calculates statistics for three customizable retracement levels, tracking frequency and percentage of occurrences for both upside breakouts and downside breakdowns based on configurable breakout criteria using close or high/low prices.
- by size. analyzes opening range breakouts categorized by the size of the opening range as a percentage.
- by time. analyzes opening range breakouts to determine if they occur before or after a specified time threshold during the trading day.
- by weekday. analyzes opening range breakouts grouped by weekday, tracking price breaks above and below the opening range high and low levels.
how traders use opening range breakout data
- identifying breakout trading opportunities when price moves above opening range highs
- setting breakdown trading signals when price falls below opening range lows
- risk management by avoiding trades on days with double breaks that create whipsaw conditions
- backtesting opening range breakout strategies across different timeframes and breakout criteria
- statistical analysis of breakout success rates for strategy optimization
the data doesn't tell you to trade. the opening range breakout report tells you the historical performance of the setup in front of you. what you do with that information is your decision.
results require customization, time, and effort. the numbers change depending on your ticker, session, and lookback period. always check the data for your specific conditions.
combining opening range breakout with other reports
the opening range breakout report works best when combined with other edgeful reports for confluence:
- use the what's in play dashboard to see opening range breakout data alongside your other favorite reports in one view
- the screener lets you scan up to 49 tickers for opening range breakout setups across 4 reports simultaneously
- edgeful AI can analyze opening range breakout data alongside other reports and find patterns you'd never spot manually
key takeaways
- the edgeful opening range breakout report measures analyzes price breakouts and breakdowns from opening range levels by grouping historical data by date and comparing subsequent price movements against the high and low established during the opening range period. tracks breakout counts, breakdown counts, double breaks, and no-break occurrences with detailed breakout information for each trading day.
- available for futures, stocks, ETFs, forex, and crypto with full session, ticker, and date range filtering
- 7 subreports available: by close, by levels, by performance, by retracement, by size, by time, by weekday
- part of the 150+ reports included in the edgeful essential plan ($49/month or $39/month annual)
- works best when combined with other reports using what's in play, the screener, or edgeful AI
trading involves risk. past performance and historical data do not guarantee future results. the statistics referenced in this post are based on historical data and may not reflect future market conditions. always trade with proper risk management.