opening candle continuation report: what it measures and how traders use it
the opening candle continuation report on edgeful analyzes the relationship between opening candle color and daily performance by tracking green and red opening candles within specified timeframes. it counts how often green days follow green opening candles versus red days follow green opening candles, and the same for red opening candles.
this is one of the 150+ reports available on the edgeful platform. here's how it works, what the data shows, and how traders use it.
table of contents
- what the opening candle continuation report measures
- how the calculation works
- available subreports
- how traders use opening candle continuation data
- combining opening candle continuation with other reports
- key takeaways
what the opening candle continuation report measures
the opening candle continuation report analyzes the relationship between opening candle color and daily performance by tracking green and red opening candles within specified timeframes. it counts how often green days follow green opening candles versus red days follow green opening candles, and the same for red opening candles.
the report is available for futures, stocks, ETFs, forex, and crypto. you can filter by ticker, session (NY, London, Asian, full globex, or custom), and lookback period (1 month to 5+ years).
how the calculation works
the opening candle continuation report looks at the color of the opening candle and tracks whether the rest of the day follows the same direction.
- the report identifies whether the opening candle closes green (up) or red (down) within the timeframe you specify
- it then checks how the full day closes. did a green opening candle lead to a green day, or did it reverse?
- percentages are calculated for each combination: green open into green day, green open into red day, red open into green day, red open into red day
- this gives you a statistical read on how predictive the opening candle is for daily direction
available subreports
the opening candle continuation report has 3 subreports for deeper analysis:
by close. analyzes historical price data to track whether daily closing prices continue above or below opening candle levels based on either wick extremes or closing prices. Groups data by trading dates and categorizes opening candles as green or red, then measures if the daily close exceeds the opening candle high/low (wick mode) or opening candle close (close mode). Calculates frequency counts and percentages for each continuation pattern.
by size. analyzes the relationship between opening candle size and subsequent day performance by categorizing opening ranges into five size buckets (0-0.2%, 0.2-0.39%, 0.4-0.59%, 0.6-0.89%, >0.9%) and tracking whether green or red opening candles lead to green or red days. Uses grouped daily data with configurable candle timeframes to calculate opening range size as percentage of opening price and measures day performance using either open-to-close or close-to-close methodology.
by weekday. analyzes the relationship between opening candle color (green/red) and subsequent daily performance across different weekdays.
how traders use opening candle continuation data
- identifying continuation patterns after green opening candles to anticipate daily direction
- measuring reliability of opening candle signals for intraday trend following
- setting expectations for daily performance based on opening period price action
- risk assessment using historical frequency data of opening candle continuation patterns
- timing entries based on opening candle color and historical success rates
the data doesn't tell you to trade. the opening candle continuation report tells you the historical performance of the setup in front of you. what you do with that information is your decision.
results require customization, time, and effort. the numbers change depending on your ticker, session, and lookback period. always check the data for your specific conditions.
combining opening candle continuation with other reports
the opening candle continuation report works best when combined with other edgeful reports for confluence:
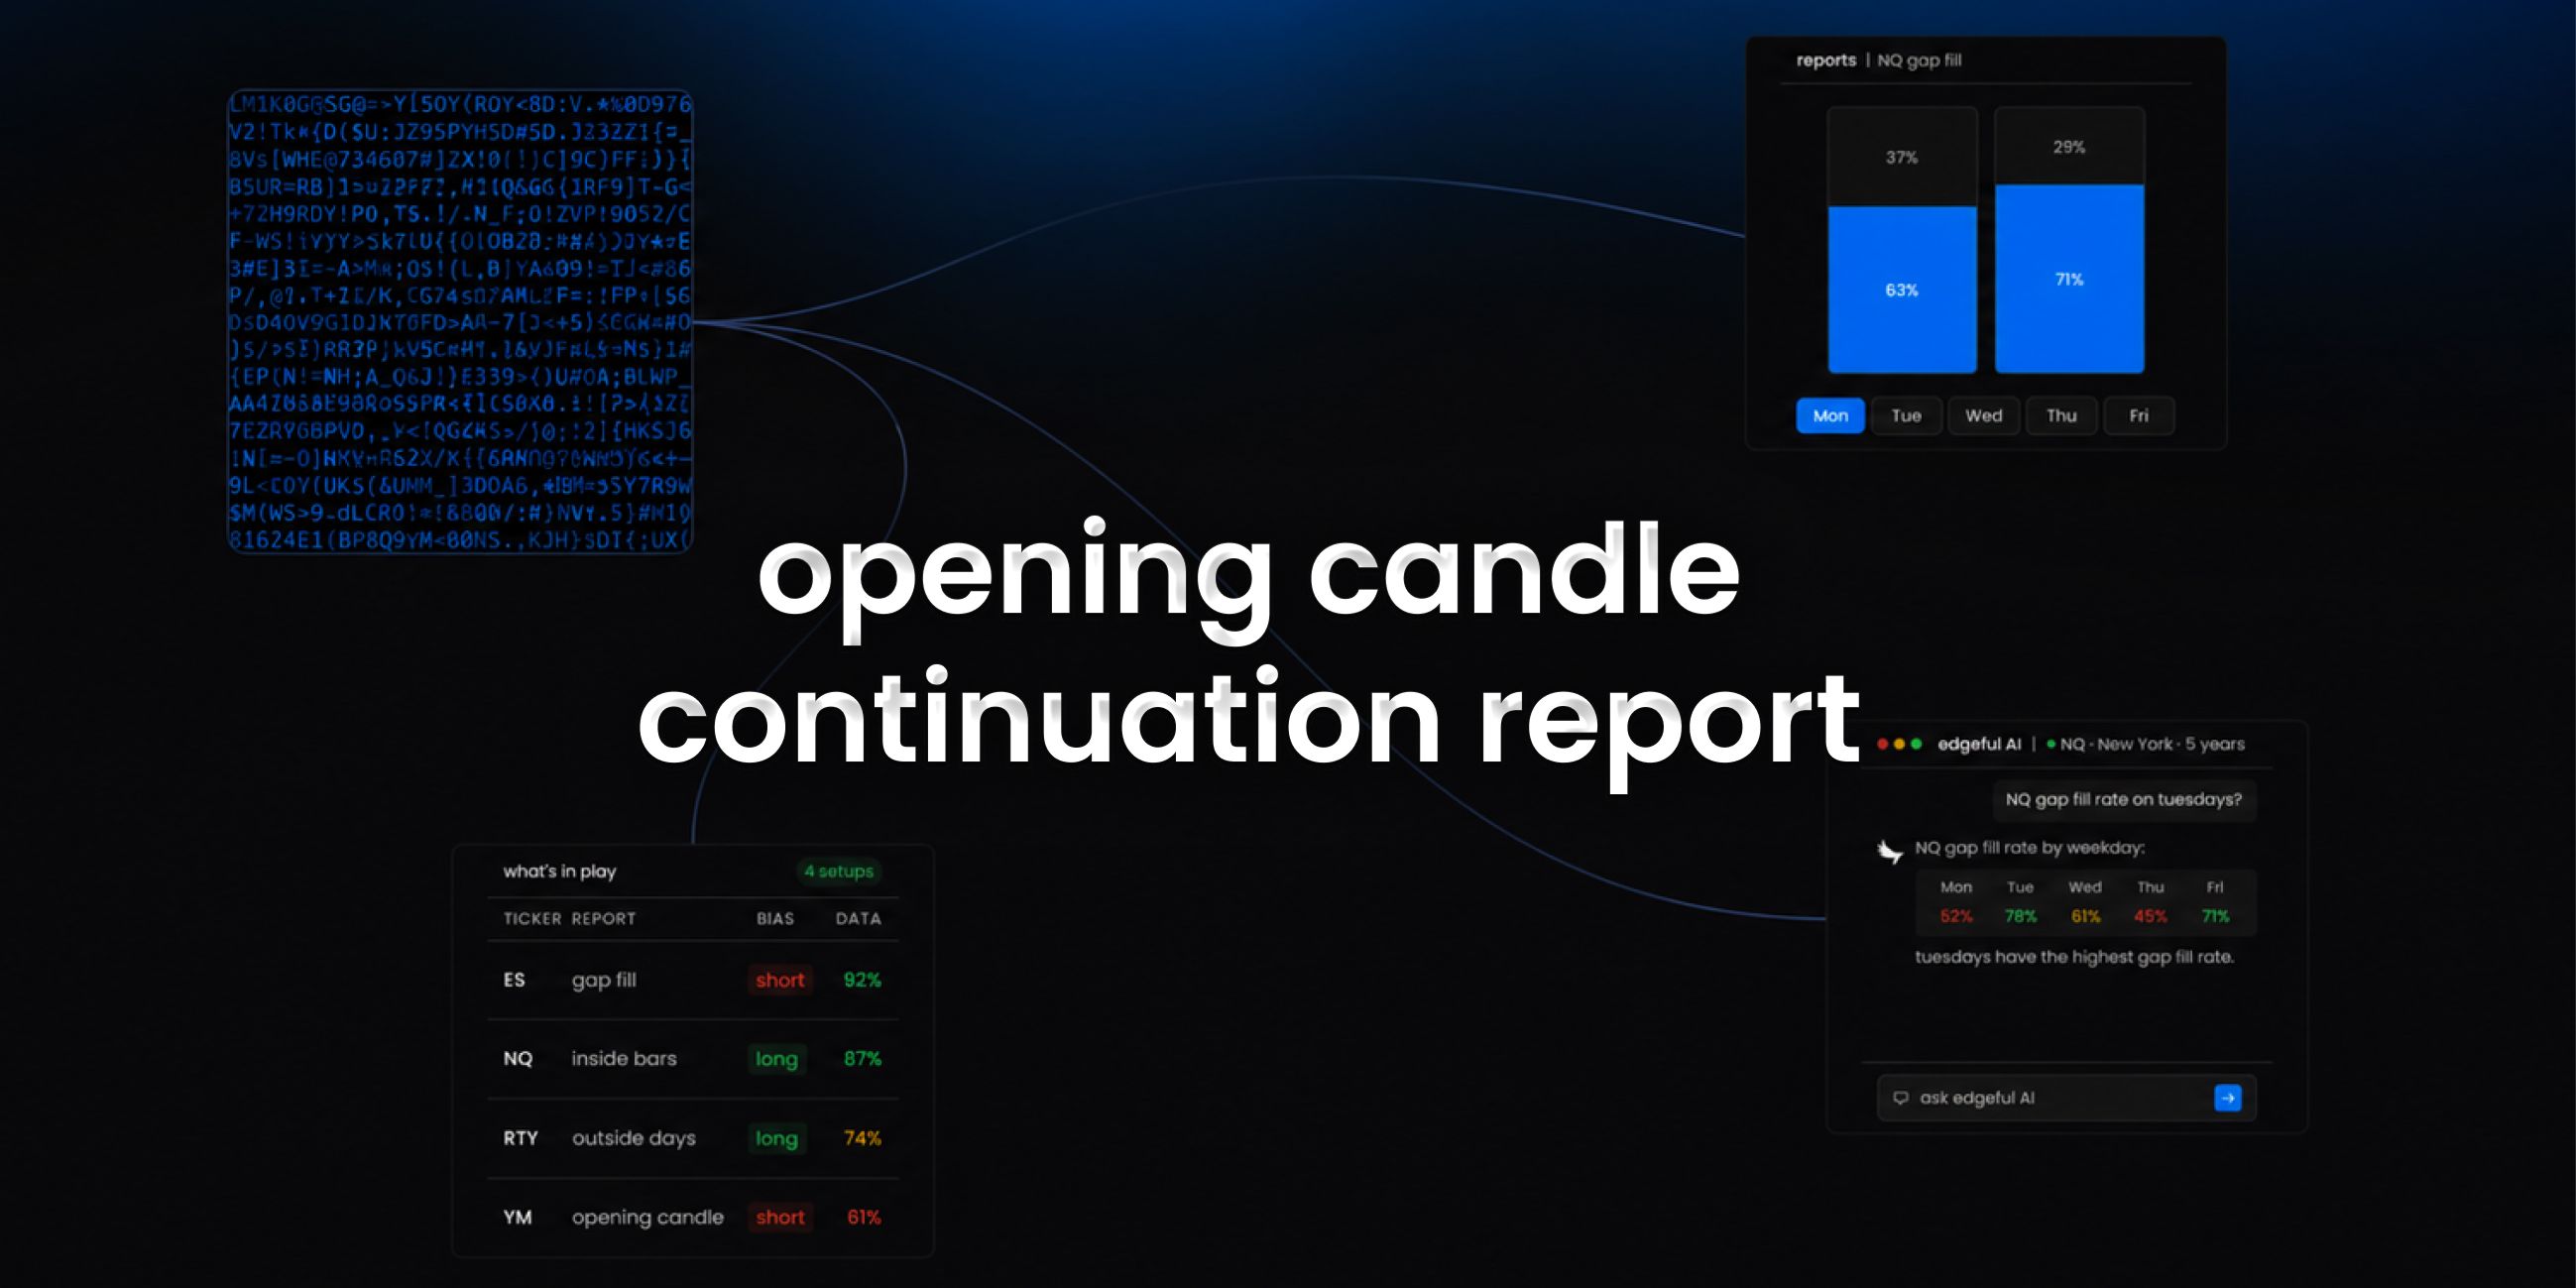
- use the what's in play dashboard to see opening candle continuation data alongside your other favorite reports in one view
- the screener lets you scan up to 49 tickers for opening candle continuation setups across 4 reports simultaneously
- edgeful AI can analyze opening candle continuation data alongside other reports and find patterns you'd never spot manually
key takeaways
- the edgeful opening candle continuation report measures analyzes the relationship between opening candle color and subsequent daily performance by tracking green and red opening candles within specified timeframes. the calculation counts occurrences of green days following green opening candles versus red days following green opening candles, and similarly for red opening candles. returns frequency counts and percentage statistics for each continuation pattern.
- available for futures, stocks, ETFs, forex, and crypto with full session, ticker, and date range filtering
- 3 subreports available: by close, by size, by weekday
- part of the 150+ reports included in the edgeful essential plan ($49/month or $39/month annual)
- works best when combined with other reports using what's in play, the screener, or edgeful AI
trading involves risk. past performance and historical data do not guarantee future results. the statistics referenced in this post are based on historical data and may not reflect future market conditions. always trade with proper risk management.