market session breakout report: what it measures and how traders use it
the market session breakout report on edgeful analyzes breakout patterns between two trading sessions by comparing session highs and lows to determine if the second session breaks above the first session's high, below the first session's low, both sides, or neither.
this is one of the 150+ reports available on the edgeful platform. here's how it works, what the data shows, and how traders use it.
table of contents
- what the market session breakout report measures
- how the calculation works
- available subreports
- how traders use market session breakout data
- combining market session breakout with other reports
- key takeaways
what the market session breakout report measures
the market session breakout report analyzes breakout patterns between two trading sessions by comparing session highs and lows to determine if the second session breaks above the first session's high, below the first session's low, both sides, or neither.
the report is available for futures, stocks, ETFs, forex, and crypto. you can filter by ticker, session (NY, London, Asian, full globex, or custom), and lookback period (1 month to 5+ years).
how the calculation works
according to edgeful data, the market session breakout report follows this process:
- identify the previous session's high and low price range
- track whether the current session's price breaks above the high, below the low, both, or neither
- classify each day as single break (high only or low only), double break, or no break
- calculate percentages for each outcome across the selected date range
- break down results by session pair for comparison
available subreports
the market session breakout report has 3 subreports for deeper analysis:
- by levels. measures how far beyond the previous session's range price extends after a breakout. used for setting profit targets based on historical extension data.
- by size. filters breakout data by the size of the previous session's range. smaller ranges may produce different breakout characteristics than wider ranges.
- by weekday. breaks down session breakout patterns by day of the week. different weekdays often show dramatically different breakout frequencies and directions.
how traders use market session breakout data
- targeting the prior session's high or low to break during the current session
- using other reports (like opening candle continuation or IB) for directional confluence on which side will break
- identifying which session pairs produce the most consistent breakout patterns for their trading schedule
- setting profit targets based on historical extension data from the by-levels subreport
the data doesn't tell you to trade. the market session breakout report tells you the historical performance of the setup in front of you. what you do with that information is your decision.
results require customization, time, and effort. the numbers change depending on your ticker, session, and lookback period. always check the data for your specific conditions.
combining market session breakout with other reports
the market session breakout report works best when combined with other edgeful reports for confluence:
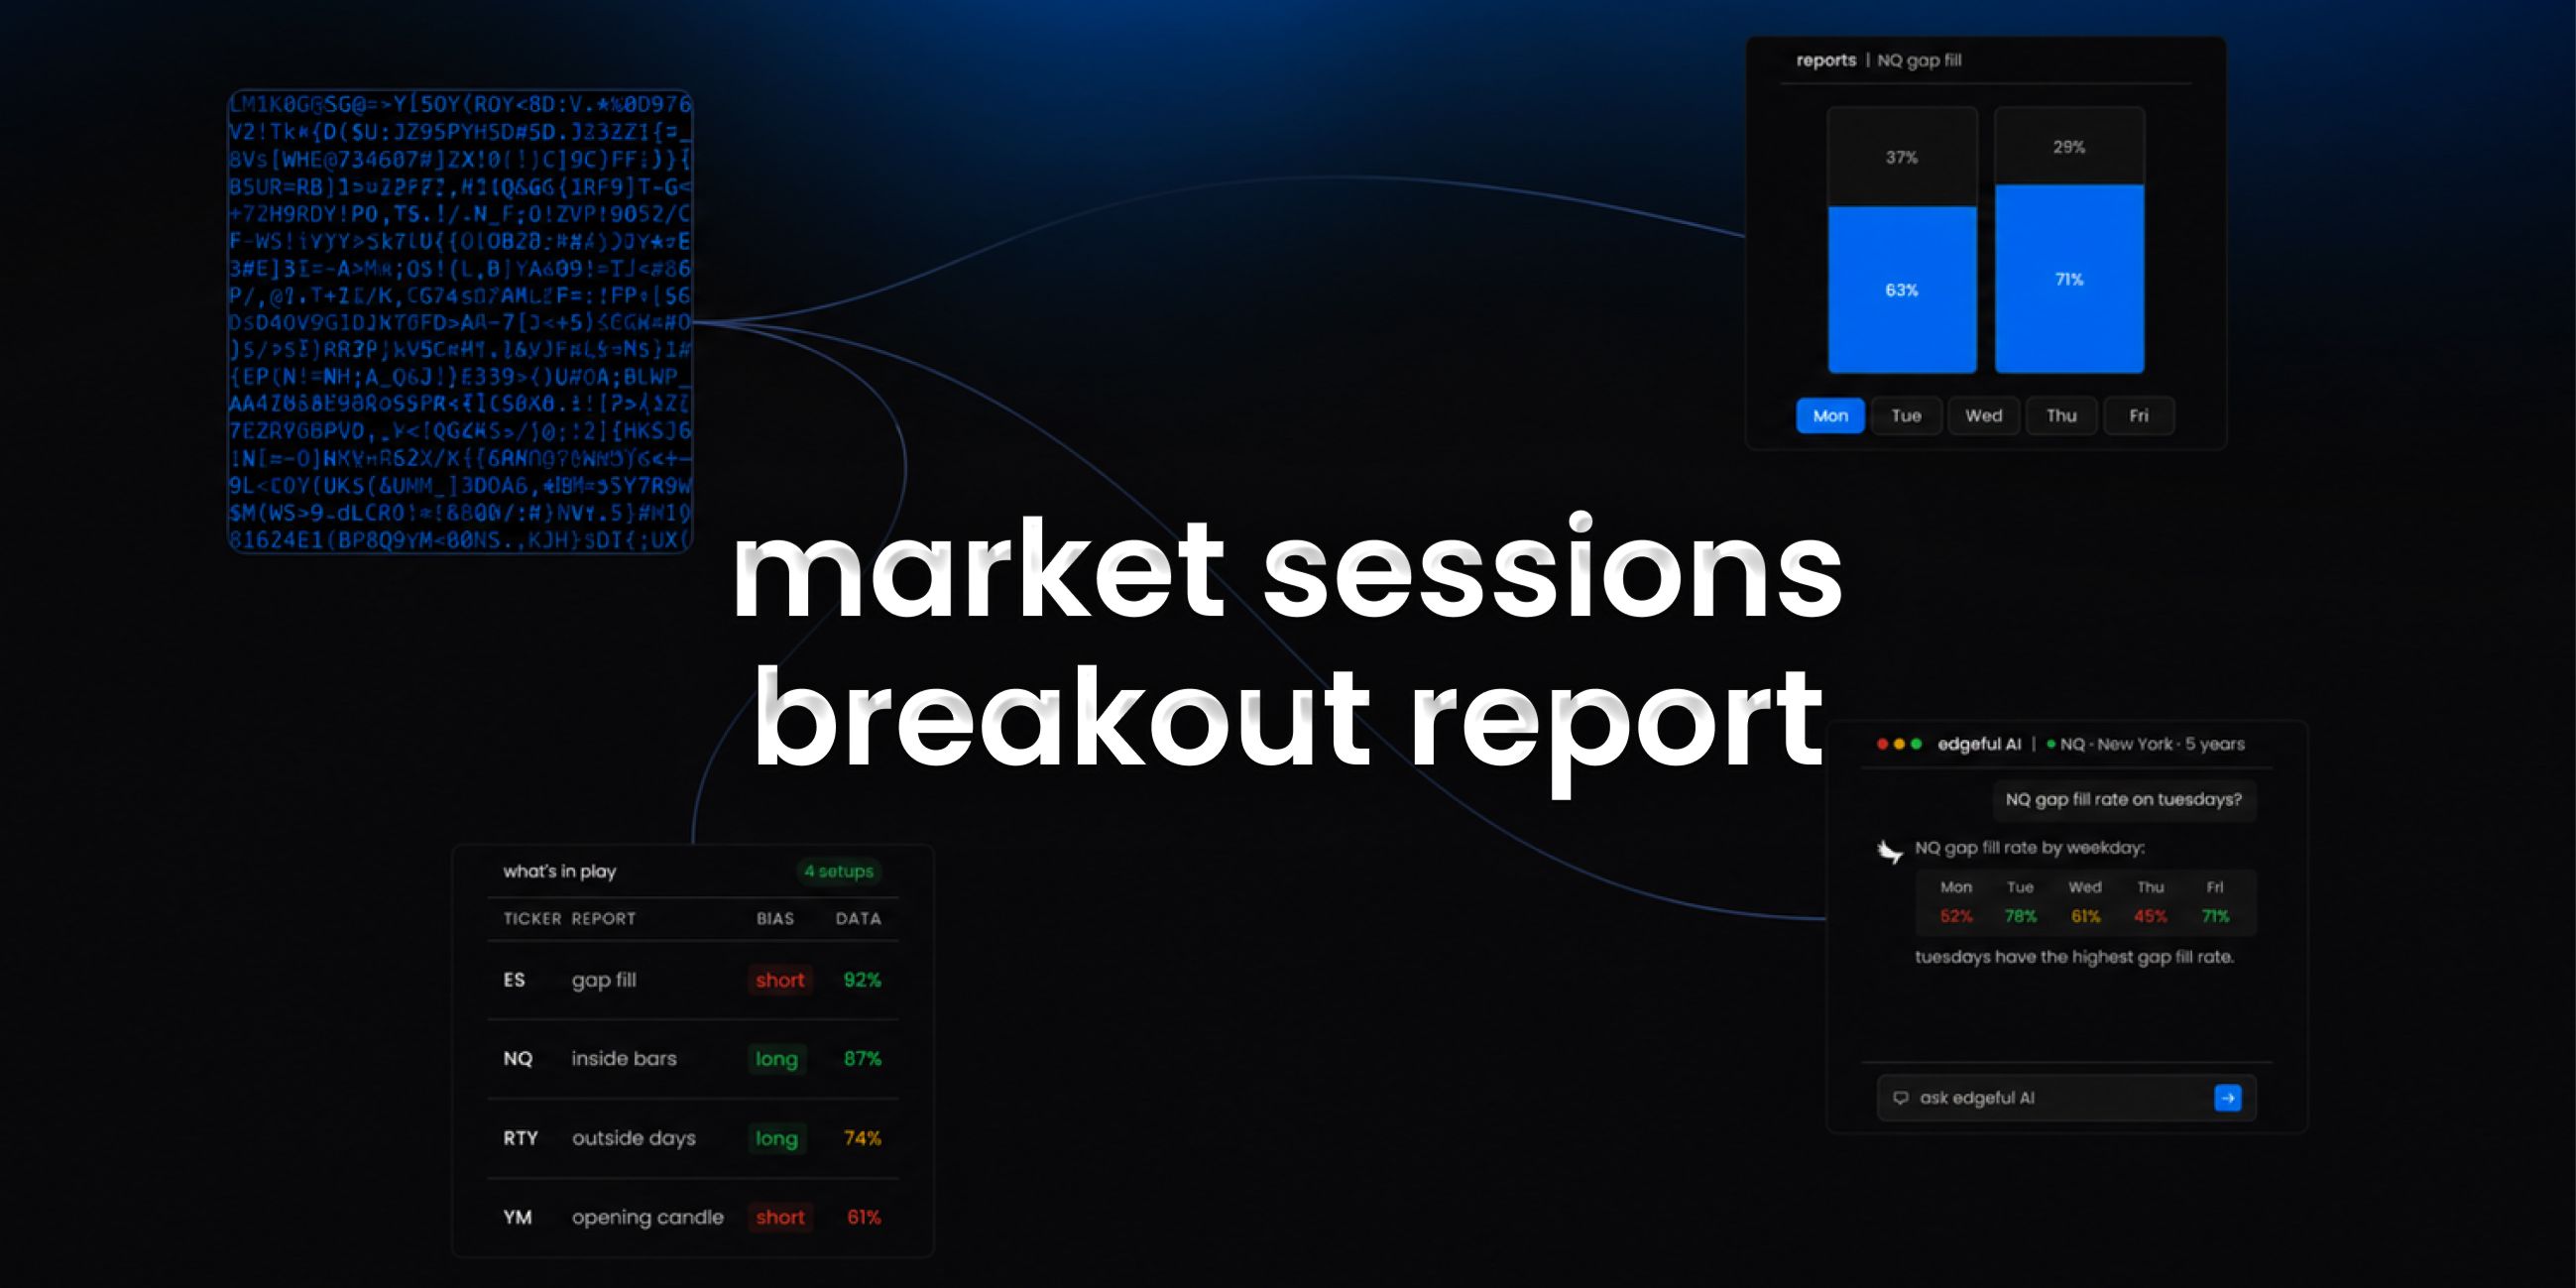
- use the what's in play dashboard to see market session breakout data alongside your other favorite reports in one view
- the screener lets you scan up to 49 tickers for market session breakout setups across 4 reports simultaneously
- edgeful AI can analyze market session breakout data alongside other reports and find patterns you'd never spot manually
key takeaways
- the edgeful market session breakout report tracks how often one session breaks out of the previous session's high/low range
- classifies outcomes as single break, double break, or no break with percentage distributions
- available for futures, stocks, ETFs, forex, and crypto with full session, ticker, and date range filtering
- 3 subreports available: by levels, by size, by weekday
- part of the 150+ reports included in the edgeful essential plan ($49/month or $39/month annual)
- works best when combined with other reports using what's in play, the screener, or edgeful AI
trading involves risk. past performance and historical data do not guarantee future results. the statistics referenced in this post are based on historical data and may not reflect future market conditions. always trade with proper risk management.