initial balance breakout report: what it measures and how traders use it
the initial balance breakout report on edgeful analyzes IB breakout patterns by tracking when price breaks above or below the high and low set during the initial balance period. it determines breakout frequency across single breaks, double breaks, and no breaks, with optional weekday-specific analysis for crypto and traditional markets.
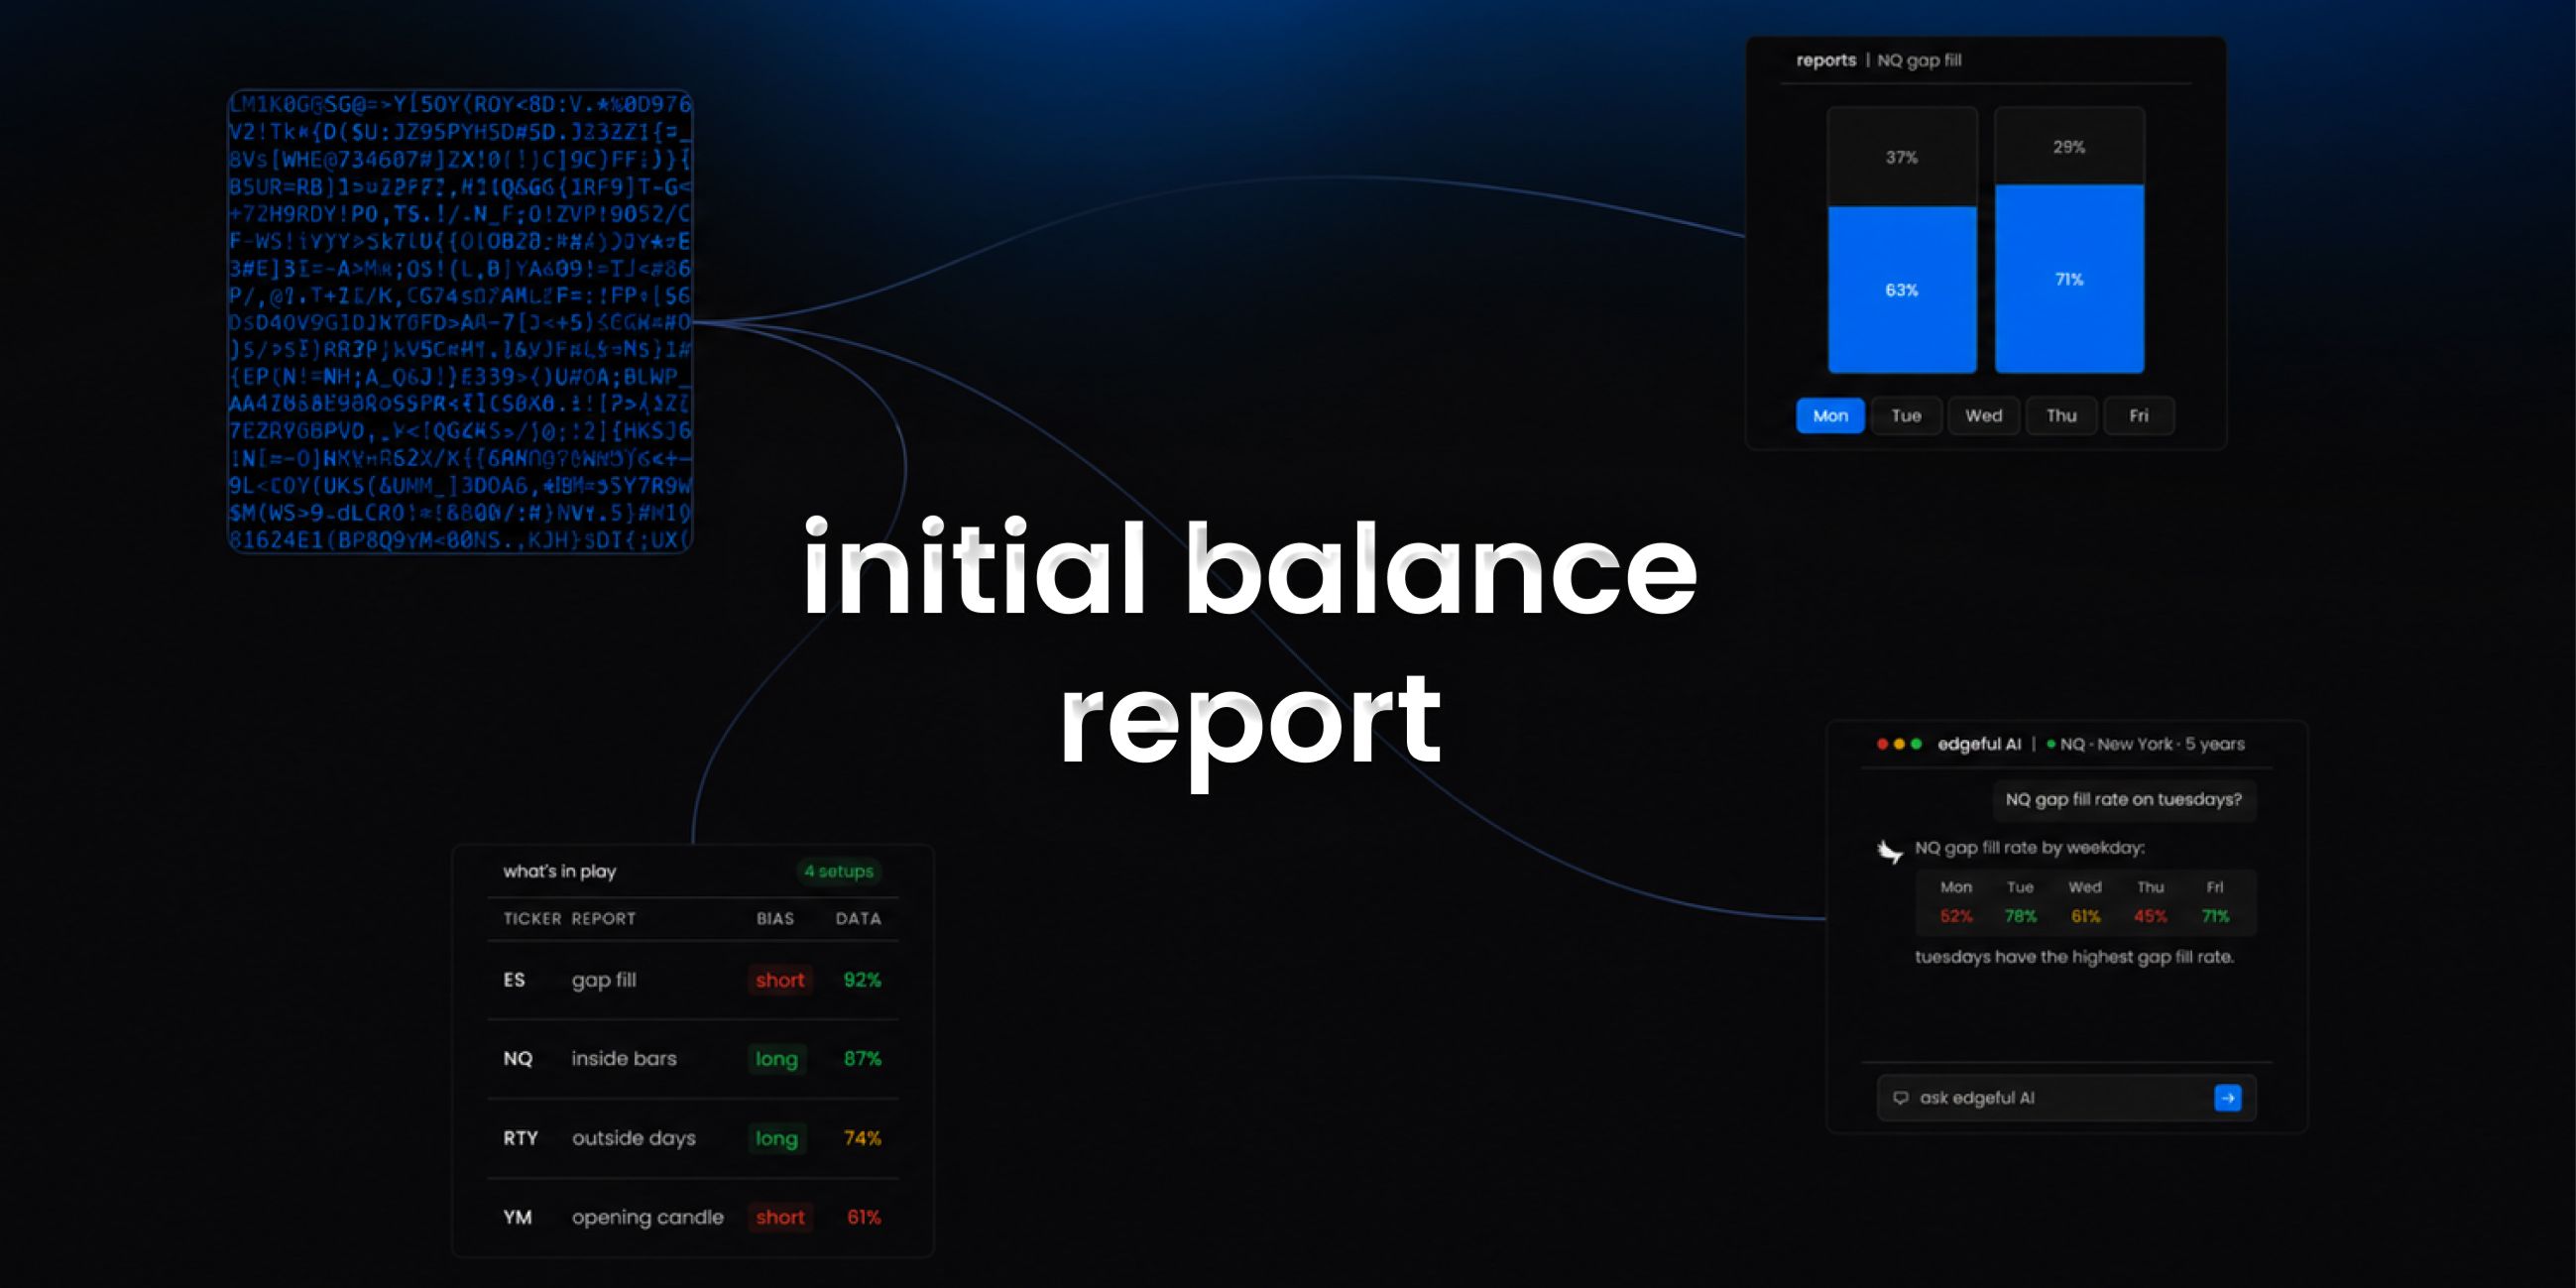
this is one of the 150+ reports available on the edgeful platform. here's how it works, what the data shows, and how traders use it.
table of contents
- what the initial balance breakout report measures
- how the calculation works
- available subreports
- how traders use initial balance breakout data
- combining initial balance breakout with other reports
- key takeaways
what the initial balance breakout report measures
the initial balance breakout report analyzes IB breakout patterns by tracking when price breaks above or below the high and low set during the initial balance period. it determines breakout frequency across single breaks, double breaks, and no breaks, with optional weekday-specific analysis for crypto and traditional markets.
the report is available for futures, stocks, ETFs, forex, and crypto. you can filter by ticker, session (NY, London, Asian, full globex, or custom), and lookback period (1 month to 5+ years).
how the calculation works
the initial balance breakout report identifies the high and low established during the initial balance period (the first hour of trading by default), then tracks what happens after.
- the report marks the highest price and lowest price during the IB period as the reference levels
- it then monitors the rest of the trading session for breaks above the IB high, below the IB low, or both
- you can choose whether breakouts are determined by close price or wick (high/low) touches
- each day is classified as: breakout (only IB high broken), breakdown (only IB low broken), double break (both broken), or no break (price stayed within the IB range)
- percentages are calculated for how often each outcome occurs across your selected timeframe and filters
available subreports
the initial balance breakout report has 10 subreports for deeper analysis:
by breakout. analyzes initial balance periods to categorize daily breakout patterns into four types: breakouts above IB high, breakdowns below IB low, double breaks (both directions), and no breaks. Filters data by specified weekdays and IB size ranges, then tracks breakout occurrences using either close prices or high/low prices as breakout criteria.
by close. analyzes where price closes relative to the initial balance range after breakouts occur. Groups historical data by date, calculates initial balance high/low from the first portion of each session, then tracks whether the final close of each day falls within the IB range, above IB high, or below IB low. Provides percentage statistics and detailed daily records for different breakout scenarios.
by double break. analyzes initial balance breakout patterns by tracking whether price breaks occur as single breaks or double breaks (both high and low broken on same day).
by levels. analyzes how far price extends beyond initial balance boundaries using predefined level multipliers. Calculates statistics on breakout and breakdown levels reached, filtering by initial balance size ranges and day types. Returns level-by-level hit rates and detailed daily breakout measurements.
by performance. analyzes initial balance breakouts by measuring extension performance and range when price breaks above or below the initial balance period high/low.
by rejection. analyzes which initial balance boundary (high or low) forms first during the IB period, then tracks which boundary gets broken first after the IB period ends. Calculates statistics on whether price breaks in the same direction as the first boundary formed or in the opposite direction. Uses configurable IB periods, size filters, and breakout criteria based on close or wick touches.
by retracement. analyzes initial balance periods to identify breakouts and breakdowns, then measures retracement levels after each break occurs.
by size. analyzes initial balance breakout patterns categorized by the size of the initial balance range as a percentage of price.
by time. analyzes initial balance breakouts and breakdowns to determine whether they occur before or after a specified time threshold.
by weekday. analyzes initial balance breakout patterns across different weekdays by calculating high and low breakouts after the initial balance period ends.
how traders use initial balance breakout data
- identifying days when initial balance ranges are likely to be broken for directional trading setups
- determining optimal entry timing based on single versus double breakout probability patterns
- risk management by understanding weekday-specific breakout frequencies for position sizing
- setting profit targets based on historical breakout behavior during specific market periods
- market session planning using weekday breakout statistics for crypto versus traditional market timing
the data doesn't tell you to trade. the initial balance breakout report tells you the historical performance of the setup in front of you. what you do with that information is your decision.
results require customization, time, and effort. the numbers change depending on your ticker, session, and lookback period. always check the data for your specific conditions.
combining initial balance breakout with other reports
the initial balance breakout report works best when combined with other edgeful reports for confluence:
- use the what's in play dashboard to see initial balance breakout data alongside your other favorite reports in one view
- the screener lets you scan up to 49 tickers for initial balance breakout setups across 4 reports simultaneously
- edgeful AI can analyze initial balance breakout data alongside other reports and find patterns you'd never spot manually
key takeaways
- the edgeful initial balance breakout report measures analyzes initial balance breakout patterns by tracking when price breaks above or below the high and low established during the initial balance period. the calculation determines breakout frequency across single breaks, double breaks, and no breaks, with optional weekday-specific analysis for crypto and traditional markets.
- available for futures, stocks, ETFs, forex, and crypto with full session, ticker, and date range filtering
- 10 subreports available: by breakout, by close, by double break, by levels, by performance, by rejection, by retracement, by size, by time, by weekday
- part of the 150+ reports included in the edgeful essential plan ($49/month or $39/month annual)
- works best when combined with other reports using what's in play, the screener, or edgeful AI
trading involves risk. past performance and historical data do not guarantee future results. the statistics referenced in this post are based on historical data and may not reflect future market conditions. always trade with proper risk management.