high and low by weekday report: what it measures and how traders use it
the high and low by weekday report on edgeful analyzes historical price data to count how often the weekly high and weekly low occur on each weekday. it groups data by ISO week, identifies the day with the highest high and lowest low for each week, and accumulates counts by weekday.
you get a date range summary along with the weekday distribution for weekly high and low occurrences.
this is one of the 150+ reports available on the edgeful platform. here's how it works, what the data shows, and how traders use it.
table of contents
- what the high and low by weekday report measures
- how the calculation works
- available subreports
- how traders use high and low by weekday data
- combining high and low by weekday with other reports
- key takeaways
what the high and low by weekday report measures
the high and low by weekday report analyzes historical price data to count how often the weekly high and weekly low occur on each weekday. it groups data by ISO week, identifies the day with the highest high and lowest low for each week, and accumulates counts by weekday.
the report is available for futures, stocks, ETFs, forex, and crypto. you can filter by ticker, session (NY, London, Asian, full globex, or custom), and lookback period (1 month to 5+ years).
how the calculation works
the high and low by weekday report measures weekly extreme formation across the five trading days.
- the report identifies the highest high and lowest low of each trading week across the lookback period
- each extreme is tagged with the weekday on which it occurred
- frequencies are calculated showing what percentage of weekly highs and lows form on each weekday
- the by-weekly-candle subreport splits the results by green vs red weeks
- this gives you a statistical breakdown of when weekly extremes are most likely to form
available subreports
the high and low by weekday report has 2 subreports for deeper analysis:
by close. measures whether the weekly close itself tends to come in near the weekly high, weekly low, or somewhere in the middle by weekday.
by weekly candle. splits results by weekly candle direction (green or red). on red weeks, weekly lows cluster heavily on friday. on green weeks, weekly highs cluster on thursday or friday. this is essential context for swing traders.
how traders use high and low by weekday data
- timing swing entries by knowing which weekday typically produces the weekly extreme
- setting expectations for monday-tuesday vs late-week price action
- pairing with directional bias to predict whether the week is likely to end at its high or low
- avoiding swing exits early in the week when the extreme typically forms later
- risk management by knowing when weekly reversals are statistically more likely
the data doesn't tell you to trade. the high and low by weekday report tells you the historical performance of the setup in front of you. what you do with that information is your decision.
results require customization, time, and effort. the numbers change depending on your ticker, session, and lookback period. always check the data for your specific conditions.
combining high and low by weekday with other reports
the high and low by weekday report works best when combined with other edgeful reports for confluence:
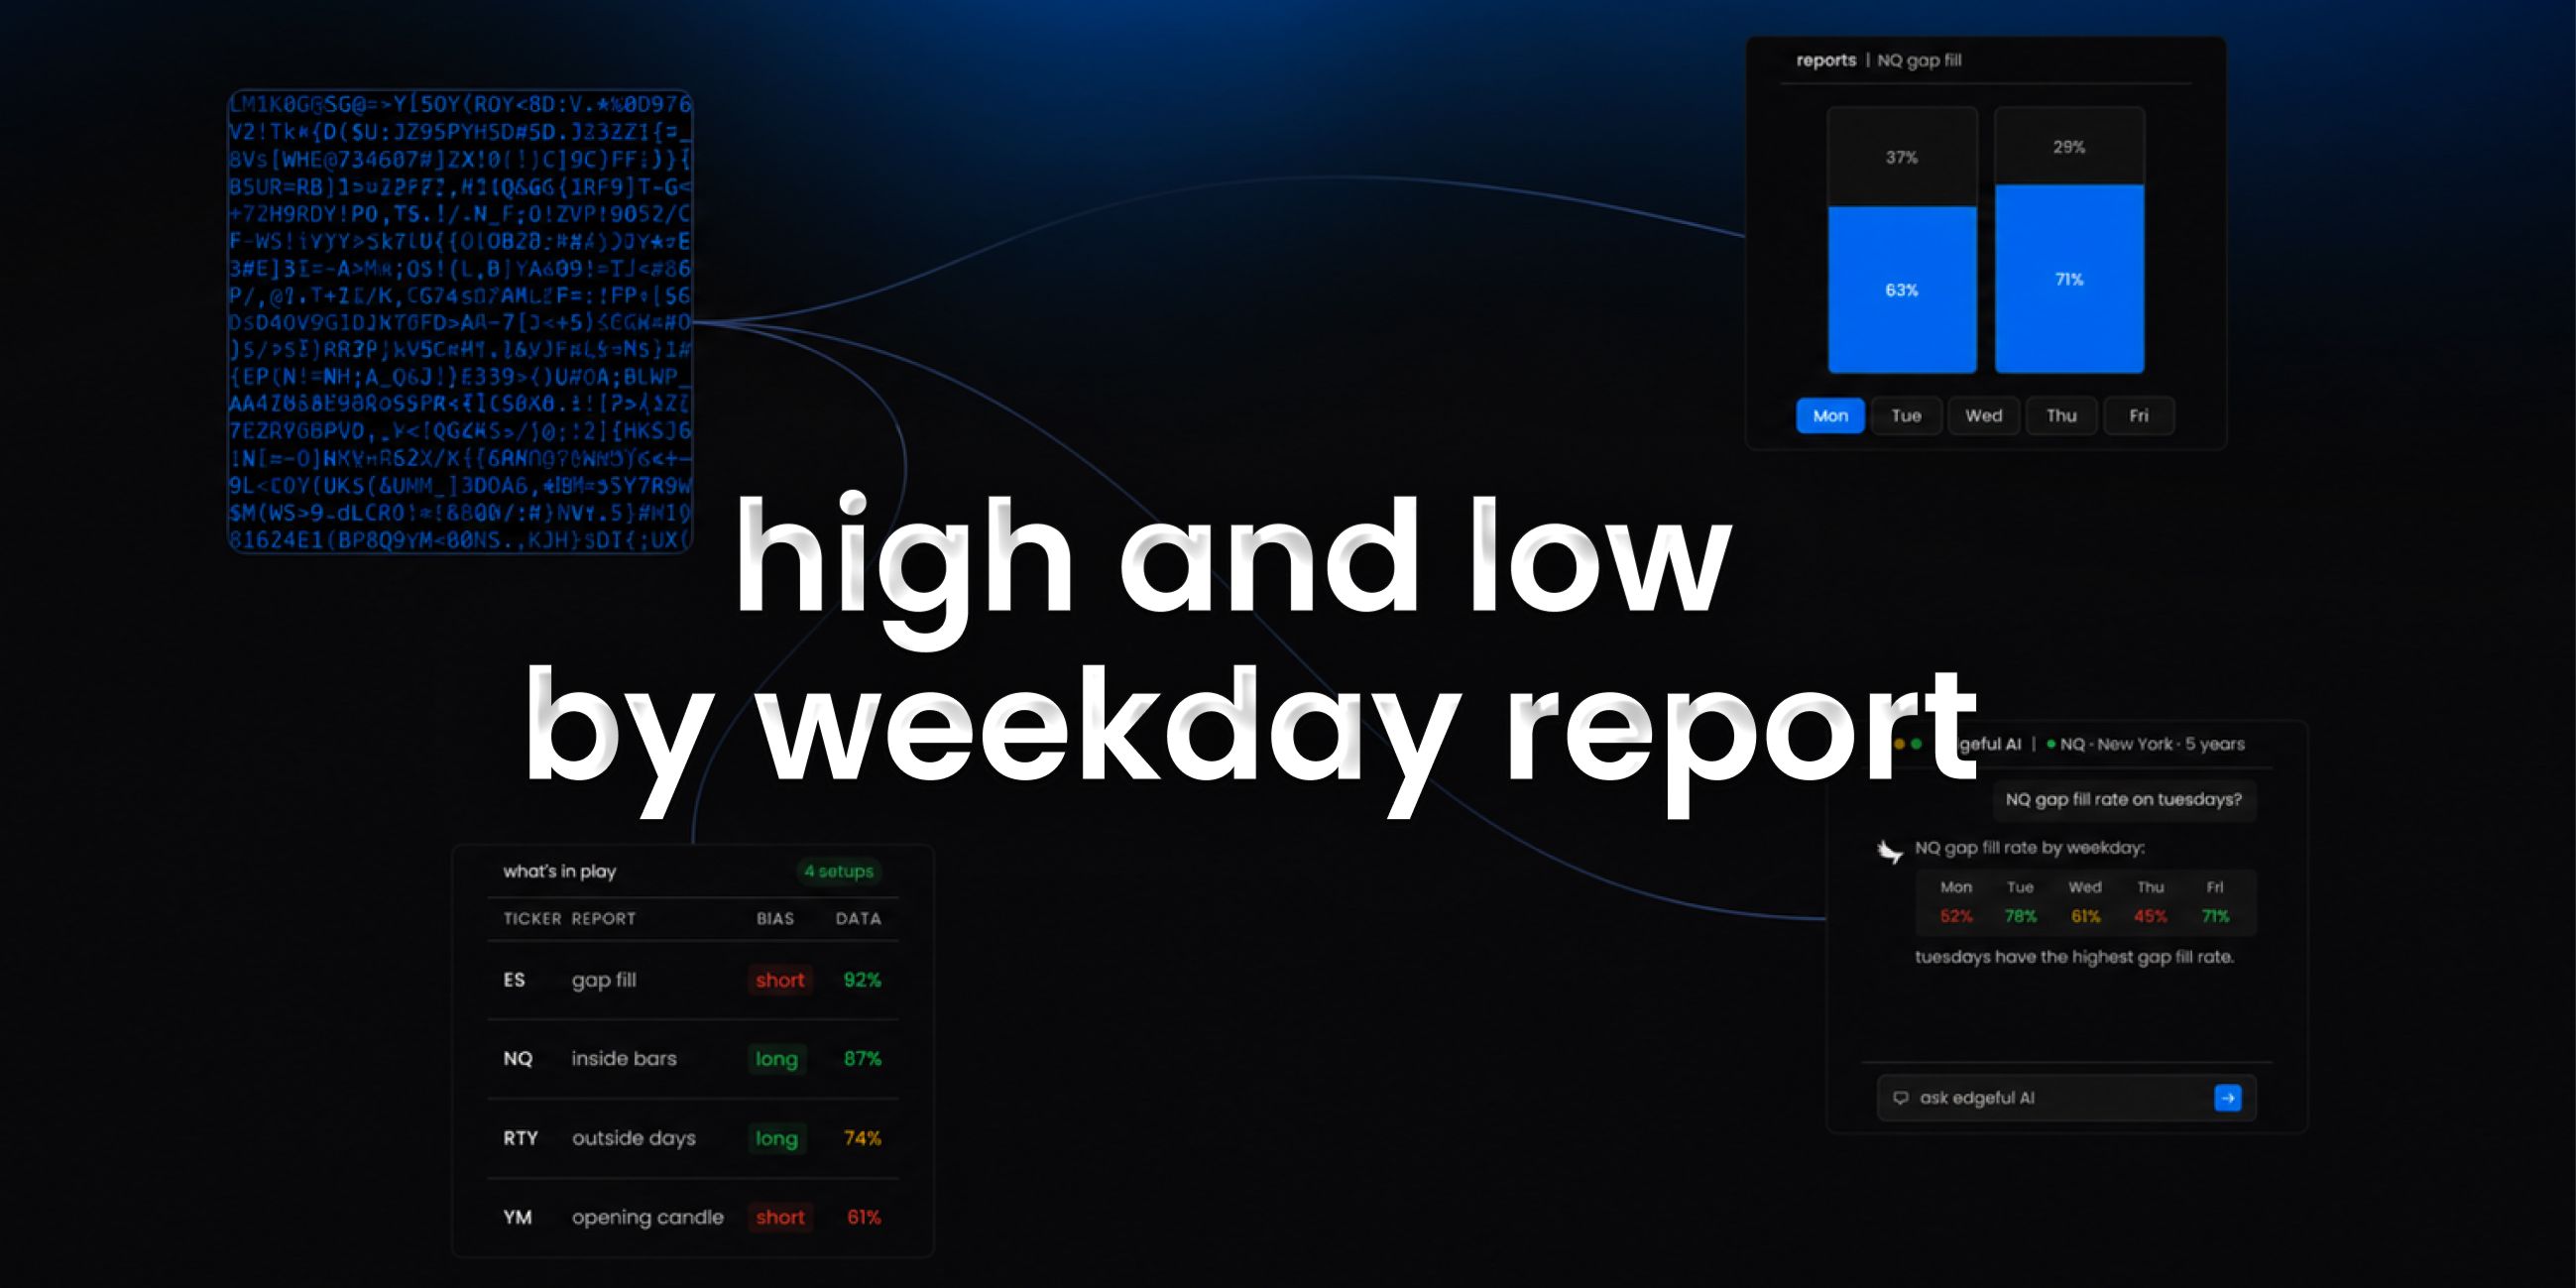
- use the what's in play dashboard to see high and low by weekday data alongside your other favorite reports in one view
- the screener lets you scan up to 49 tickers for high and low by weekday setups across 4 reports simultaneously
- edgeful AI can analyze high and low by weekday data alongside other reports and find patterns you'd never spot manually
key takeaways
- the edgeful high and low by weekday report measures which weekday tends to produce the weekly high and low
- available for futures, stocks, ETFs, forex, and crypto with full session, ticker, and date range filtering
- 2 subreports available: by close, by weekly candle
- part of the 150+ reports included in the edgeful essential plan ($49/month or $39/month annual)
- works best when combined with other reports using what's in play, the screener, or edgeful AI
trading involves risk. past performance and historical data do not guarantee future results. the statistics referenced in this post are based on historical data and may not reflect future market conditions. always trade with proper risk management.