ES futures trading strategies: data-backed approaches for day trading the S&P 500
ES is the most traded equity index futures contract in the world. if you're looking for proven ES futures trading strategies, this is one of the best instruments to build them on — every day, millions of contracts change hands as institutions, hedge funds, prop firms, and retail traders all converge on the same instrument.
there's a reason S&P 500 futures trading dominates the day trading world:
ES gives you exposure to the S&P 500 in the most liquid, most accessible form available. the spreads are tight, the volume is deep, and the market is open nearly 24 hours.
but liquidity alone doesn't give you an edge. what gives you an edge is knowing how ES behaves — across sessions, across setups, across days of the week — and trading the patterns that the data supports. that's what this guide is about: specific es futures trading strategies backed by real data from edgeful's reports, covering everything from ES day trading setups to session-level analysis.
table of contents
- what is ES (S&P 500 futures)
- ES contract specifications
- why ES is the gold standard for futures day trading
- ES vs NQ: which one should you trade
- ES session behavior: when ES moves most
- ES by day of week
- 5 data-backed es futures trading strategies
- risk management for es futures trading strategies
- building your ES day trading routine
- common es futures trading mistakes to avoid
- key takeaways
what is ES (S&P 500 futures)
ES is the E-mini S&P 500 futures contract. it tracks the S&P 500 index — the 500 largest publicly traded companies in the United States, spanning every sector: technology, healthcare, financials, energy, consumer, industrials, and more. understanding what ES is and how it works is the foundation for any es futures trading strategies you build.
when you trade ES, you're trading the broadest measure of the US stock market in futures form. that diversification is what makes S&P 500 futures trading on ES behave differently from NQ — it's less reactive to single-sector news and tends to move more smoothly.
the full-size ES contract has a multiplier of $50 per point. the micro version — MES (Micro E-mini S&P 500) — has a $5 per point multiplier, making it the entry point for most newer futures traders looking to practice ES day trading with smaller risk.
ES contract specifications
- exchange: CME Group
- ticker: ES (E-mini), MES (micro)
- multiplier: $50/point (ES), $5/point (MES)
- tick size: 0.25 points ($12.50 per tick on ES, $1.25 on MES)
- trading hours: Sunday 6:00 PM – Friday 5:00 PM ET (with daily maintenance break 5:00 – 6:00 PM ET)
- settlement: cash-settled, quarterly expiration (March, June, September, December)
- margin: varies by broker — typically $400-$1,200 for day trading ES, lower for MES
why ES is the gold standard for futures day trading
ES has been the default contract for ES day trading and S&P 500 futures trading for over two decades. here's why:
- deepest liquidity of any futures contract. you can enter and exit large positions without moving the market. even during volatile conditions, ES fills are clean
- sector diversification. ES isn't dominated by any single sector the way NQ is dominated by tech. this makes ES less prone to single-stock or single-sector shocks
- the smoothest price action. relative to NQ, ES moves more predictably. the swings are still meaningful — ES has plenty of range — but the moves tend to be less spiky
- $50 per point. the higher multiplier means each point of ES is worth $2.50 more per tick than NQ. you don't need as many points of movement to produce meaningful P&L
- MES for accessibility. the micro contract at $5/point lets you trade ES with minimal margin, making it the most popular contract for newer traders learning ES futures strategies
ES vs NQ: which one should you trade
this is one of the most common questions for futures traders. the short answer: it depends on your personality and risk tolerance.
- ES is better for traders who prefer smoother price action, more forgiving swings, and broader market exposure. it's generally the better starting point for newer traders
- NQ is better for traders who want larger range and are comfortable with faster, more volatile moves. NQ's tech-heavy composition means bigger swings in both directions
over the last 6 months, ES's NY session ATR is $95.71 vs. NQ's $449.26. ES exceeds its ATR 40.94% of the time vs. NQ's 37.8%.
we covered this in depth in our ES vs NQ comparison — it's worth reading if you're deciding between the two.
ES futures session behavior: when ES moves most
like all futures, es futures behaves differently depending on which trading session is active.
NY session
the NY session (9:30 AM – 4:00 PM ET) is where ES produces the majority of its daily range. the opening range, initial balance, and session breakout setups all happen here.
ES NY session ATR (14-day, last 6 months): $95.71 — range exceeded 40.94% of the time (52 out of 127 days)
the first 60-90 minutes of the NY session are consistently the most active. this is where the ORB and IB setups form and where most day traders concentrate their attention.
London session
ES has moderate activity during the london session (3:00 AM – 11:00 AM ET). the range is smaller than the NY session, but the pre-market direction established during london often carries into the NY open.
ES london session ATR (14-day, last 6 months): $93.71 — range exceeded 32.28% of the time
overnight session
the overnight/asian session (7:00 PM – 4:00 AM ET) produces the smallest range for ES. volume is thin and directional moves are rare. the main value of the overnight session is the gap it creates — the difference between the prior close and the current open feeds directly into gap fill setups.
ES overnight session ATR (14-day, last 6 months): $79.89 — range exceeded only 12.6% of the time
for the full session breakdown, see our trading sessions guide.
ES futures by day of week
ES futures follows the same general weekly pattern as other equity index futures: range builds through the week and peaks on Thursday.
over the last 6 months, here's how ES's NY session range breaks down by day of week:
- Monday: $59.21
- Tuesday: $63.93
- Wednesday: $65.77
- Thursday: $74.31
- Friday: $70.73
Thursday produces the largest NY range ($74.31) — 25% more than Monday ($59.21). Friday is a close second at $70.73. the data shows range builds through the week, not the mid-week peak that conventional wisdom suggests. for the full breakdown of how to adjust your strategy by day, see our day of week trading strategy guide.
5 data-backed ES futures trading strategies
these are specific strategies you can trade on ES using edgeful's data. each one has a dedicated report that tracks its performance across timeframes and sessions.
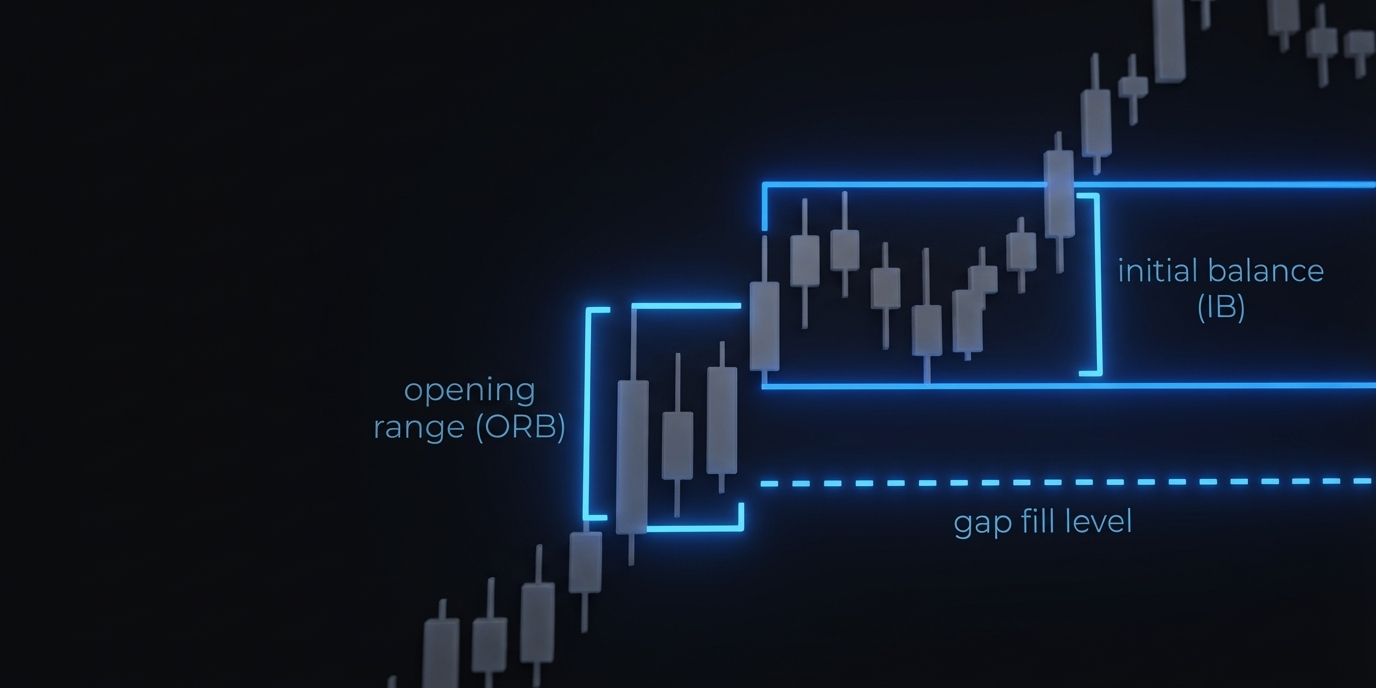
strategy 1: opening range breakout (ORB)
- what it is: trade the breakout from the first 5, 15, or 30 minutes of the NY session.
- how it works on ES futures: once the opening range is set, the ORB report shows how often price breaks above or below that range and follows through. you're looking for direction — which side of the opening range does ES break first, and does it continue?
what the data shows (ES 15min ORB, last 6 months, 127 days, NY session):
- breakouts (price breaks above ORB high): 35.43% of the time
- breakdowns (price breaks below ORB low): 27.56% of the time
- double breaks (both sides broken): 37.01% of the time
the by-close subreport tells you how often the breakout direction holds through the session close. ES closed above the ORB high 43.31% of the time and below the ORB low 36.22% of the time. only 20.47% of days closed inside the opening range — meaning nearly 80% of the time, ES commits to a direction by the close.
the setup:
- let the first 15 minutes complete to establish the opening range
- check the ORB report for ES — which direction did price break, and how often does that direction hold by close?
- enter on the break with a stop on the opposite side of the opening range
- use the ORB by-close subreport to understand which direction ES favors at the session close
for the full strategy walkthrough: ORB strategy guide
strategy 2: initial balance breakout (IB)
- what it is: trade the breakout from the first 60 minutes of the NY session.
- how it works on ES futures: the IB high and low are the first 60 minutes' range. the IB report tracks how often ES single breaks, double breaks, or no breaks this range. the by-levels subreport tells you how far price typically travels after the break.
what the data shows (ES 60min IB, last 6 months, 127 days, NY session):
- single IB break: 74.02% of the time (94 out of 127 days) — meaning nearly 3 out of 4 days, ES breaks one side of the IB and doesn't come back to break the other
- double break (both sides broken): 23.62% (30 days)
- no break: 2.36% (3 days) — ES almost always breaks the IB range
that 74% single break rate is significant. it means once ES commits to a direction after the first 60 minutes, it tends to stay on that side for the rest of the session.
the setup:
- wait for the IB to complete (10:30 AM ET for futures)
- check the IB report — which direction did ES break, and is it a single break?
- enter on the IB break with a stop inside the IB range
- use the by-levels subreport for realistic target levels
- use the by-retracement subreport for realistic stop loss levels
for the full strategy walkthrough: IB strategy guide
strategy 3: gap fill
- what it is: trade the gap between the prior session close and today's open back to the fill level.
- how it works on ES futures: overnight price action creates a gap. the gap fill report shows how often ES fills that gap back to the prior session close (PSC). you can filter by gap direction (up or down), gap size, and timeframe.
what the data shows (ES gap fill, last 6 months, NY session, full gap fill):
- gap ups filled 67% of the time (50 out of 75 days)
- gap downs filled 67% of the time (34 out of 51 days)
both directions fill at the same rate — 67%. that's a 2-out-of-3 fill rate regardless of which way ES gaps. this is one of the most consistent setups on ES.
the setup:
- at the NY open, note the gap direction and size
- check the gap fill report for ES — the current fill rate is 67% in both directions
- if the data supports a fill, look for the entry in the direction of the fill
- target = the prior session close. stop = beyond the overnight extreme
for the full strategy walkthrough: gap fill strategy guide
strategy 4: power hour breakout
- what it is: should you hold for new highs or lows during the last hour of the session?
- how it works on ES: edgeful's power hour breakout report tracks how often ES makes a new high of day (NHOD) or new low of day (NLOD) during the final hour (3:00 – 4:00 PM ET). this data helps you decide whether to hold a trade into the close or take profit before the last hour.
what the data shows (last 6 months, 122 days):
- new high of day made during power hour: 21.31% of the time (26 out of 122 days)
- new low of day made during power hour: 13.11% of the time (16 out of 122 days)
how to use it:
- if you're long and it's approaching 3:00 PM, the data says ES only makes a new HOD during power hour about 1 in 5 days. that's a reason to consider taking profit rather than holding for a breakout move
- if you're short, NLOD during power hour is even rarer — only 13% of the time. the odds of a late-session breakdown are low
strategy 5: market session correlation
- what it is: does one session's direction predict the next?
- how it works on ES: edgeful's market session correlation report shows how often the direction of one session (green or red) carries into the next. for example, if the London session closes green, how often does the NY session also close green? this helps you build a directional bias before the session even starts.
how to use it:
- before the NY open, note the direction of the london session (or overnight session)
- check the market session correlation report — how often does the NY session follow the same direction?
- use this as directional context for your opening setups. if london was bullish and the data shows high continuation, that supports a long bias at the open
risk management for ES futures
ES is more forgiving than NQ in terms of point-to-point volatility, but at $50 per point, the dollar risk is still significant.
- every point = $50. a 10-point stop loss on ES is $500 per contract. know your dollar risk before every trade
- MES gives you flexibility. at $5/point, MES lets you dial in precise position sizes. if you're working with a smaller account, MES is the better tool for managing risk
- adjust for the day and session. a Tuesday morning ES trade in the NY session has different range characteristics than a Friday afternoon trade. your stops and targets should reflect the conditions
- don't skip the stop. ES moves smoothly most of the time — but during FOMC, CPI, and surprise events, it can gap and spike. always have a stop in place
for the full framework: 9 rules for futures risk management
building your ES trading routine
here's a practical morning routine for trading ES with data:
- check the overnight gap. what's the gap direction and size? check the gap fill report for the current fill rate
- note the overnight high and low. these become reference levels for the NY session
- check the day of week. is today a high-range day or a compressed day? adjust your expectations
- watch the opening range form. as the first 15-30 minutes complete, check the ORB report. which direction did the break happen, and what's the follow-through rate?
- monitor the IB. at 10:30 AM ET, the IB is complete. check the IB report — does the data support a continuation in the breakout direction?
- use session breakout data for exits. as the session progresses, the session breakout report helps you decide whether to hold or take profit
this routine takes a few minutes each morning and gives you a data-backed framework for the entire session. for a step-by-step version, see our 3-minute day trading routine.
common mistakes ES traders make
mistake 1: not checking the reports before trading
es futures is the most liquid futures contract in the world — but that doesn't mean every setup works. the data changes over time. checking what's currently performing before you trade takes 2 minutes and can be the difference between trading with an edge and trading blind.
mistake 2: over-sizing because ES "feels safe"
es futures moves more smoothly than NQ, which can create a false sense of security. but at $50 per point, a 20-point adverse move is $1,000 per contract. don't let ES's smoother price action trick you into sizing bigger than your risk management allows.
mistake 3: ignoring the gap
the gap fill on es futures is one of the most consistent setups in futures trading. traders who skip gap analysis and go straight to ORB or IB setups are missing context that directly affects those setups. always check the gap first.
mistake 4: trading the same way every day of the week
Monday and Thursday are very different days for es futures. Thursday's NY range ($74.31) is 25% larger than Monday's ($59.21). adjust your approach based on the day — your sizing, your targets, and your willingness to be aggressive should all reflect what the current day's data looks like.
key takeaways
- ES (E-mini S&P 500) is the most liquid equity index futures contract — tight spreads, deep volume, smooth price action
- ES's NY session ATR is $95.71 over the last 6 months, exceeding ATR 40.94% of the time
- 5 data-backed strategies work well on ES: ORB, IB breakout, gap fill, session breakout, and market session correlation — each with a dedicated edgeful report
- the NY session (first 60-90 minutes especially) is where ES produces the bulk of its range and where these strategies are most effective
- Thursday ($74.31) and Friday ($70.73) produce the largest NY range on ES — not mid-week as conventional wisdom suggests. Monday ($59.21) is the most compressed
- risk management at $50/point is non-negotiable — use MES if you need smaller position sizing
- build a morning routine around the data: check the gap, watch the ORB, monitor the IB, use session breakout data for exits
edgeful provides historical performance data to help traders make informed decisions. this does not constitute financial advice. past performance is not indicative of future results. all trading involves risk — always do your own analysis and manage your risk accordingly.