engulfing candles report: what it measures and how traders use it
the engulfing candles report on edgeful identifies bullish and bearish engulfing patterns by comparing consecutive candles where the current candle fully engulfs the previous candle body. it calculates performance by tracking price movement from pattern formation until invalidation or session end.
this is one of the 150+ reports available on the edgeful platform. here's how it works, what the data shows, and how traders use it.
table of contents
- what the engulfing candles report measures
- how the calculation works
- available subreports
- how traders use engulfing candles data
- combining engulfing candles with other reports
- key takeaways
what the engulfing candles report measures
the engulfing candles report identifies bullish and bearish engulfing patterns by comparing consecutive candles where the current candle fully engulfs the previous candle body. it calculates performance by tracking price movement from pattern formation until invalidation or session end.
the report is available for futures, stocks, ETFs, forex, and crypto. you can filter by ticker, session (NY, London, Asian, full globex, or custom), and lookback period (1 month to 5+ years).
how the calculation works
according to edgeful data, the engulfing candles report follows a specific calculation process:
the engulfing candles report identifies bullish and bearish engulfing candlestick patterns and measures their subsequent performance.
- a bullish engulfing pattern occurs when the current candle's body completely engulfs the previous candle's body to the upside
- a bearish engulfing pattern is the opposite, where the current candle engulfs the previous candle to the downside
- the report measures how price moves after each pattern forms, tracking maximum favorable movement and average performance
- statistics are provided separately for bullish and bearish patterns, with breakdowns by candle size
available subreports
the engulfing candles report has 3 subreports for deeper analysis:
by daily candle. identifies engulfing candle patterns where day 2 completely engulfs day 1 by having higher high and lower low values, then tracks the color outcomes for day 2 and day 3 candles. Calculates frequency and percentage statistics for green and red candle combinations following engulfing patterns.
by rr. analyzes bullish and bearish engulfing candle patterns and calculates their success rates at multiple risk-reward ratios from 0.5R to 3.0R. The function identifies engulfing patterns based on open and close price relationships between consecutive candles, filters by candle size categories, and tracks how often each pattern reaches profit targets before hitting stop losses.
by size. analyzes bullish and bearish engulfing candlestick patterns by categorizing them into five size ranges based on the percentage move from open to close. For each size category, calculates performance statistics including count, average performance, and maximum performance for both pattern types. Returns summary statistics by size category and detailed records of individual pattern occurrences.
how traders use engulfing candles data
- identifying high-probability reversal points when current candle completely engulfs previous candle body
- setting profit targets based on average performance statistics for each pattern type
- risk management using invalidation levels where price breaks back through engulfing candle open price
- position sizing decisions informed by historical success rates and average percentage returns
- entry timing optimization by waiting for engulfing pattern confirmation at key support/resistance levels
the data doesn't tell you to trade. the engulfing candles report tells you the historical performance of the setup in front of you. what you do with that information is your decision.
results require customization, time, and effort. the numbers change depending on your ticker, session, and lookback period. always check the data for your specific conditions.
combining engulfing candles with other reports
the engulfing candles report works best when combined with other edgeful reports for confluence:
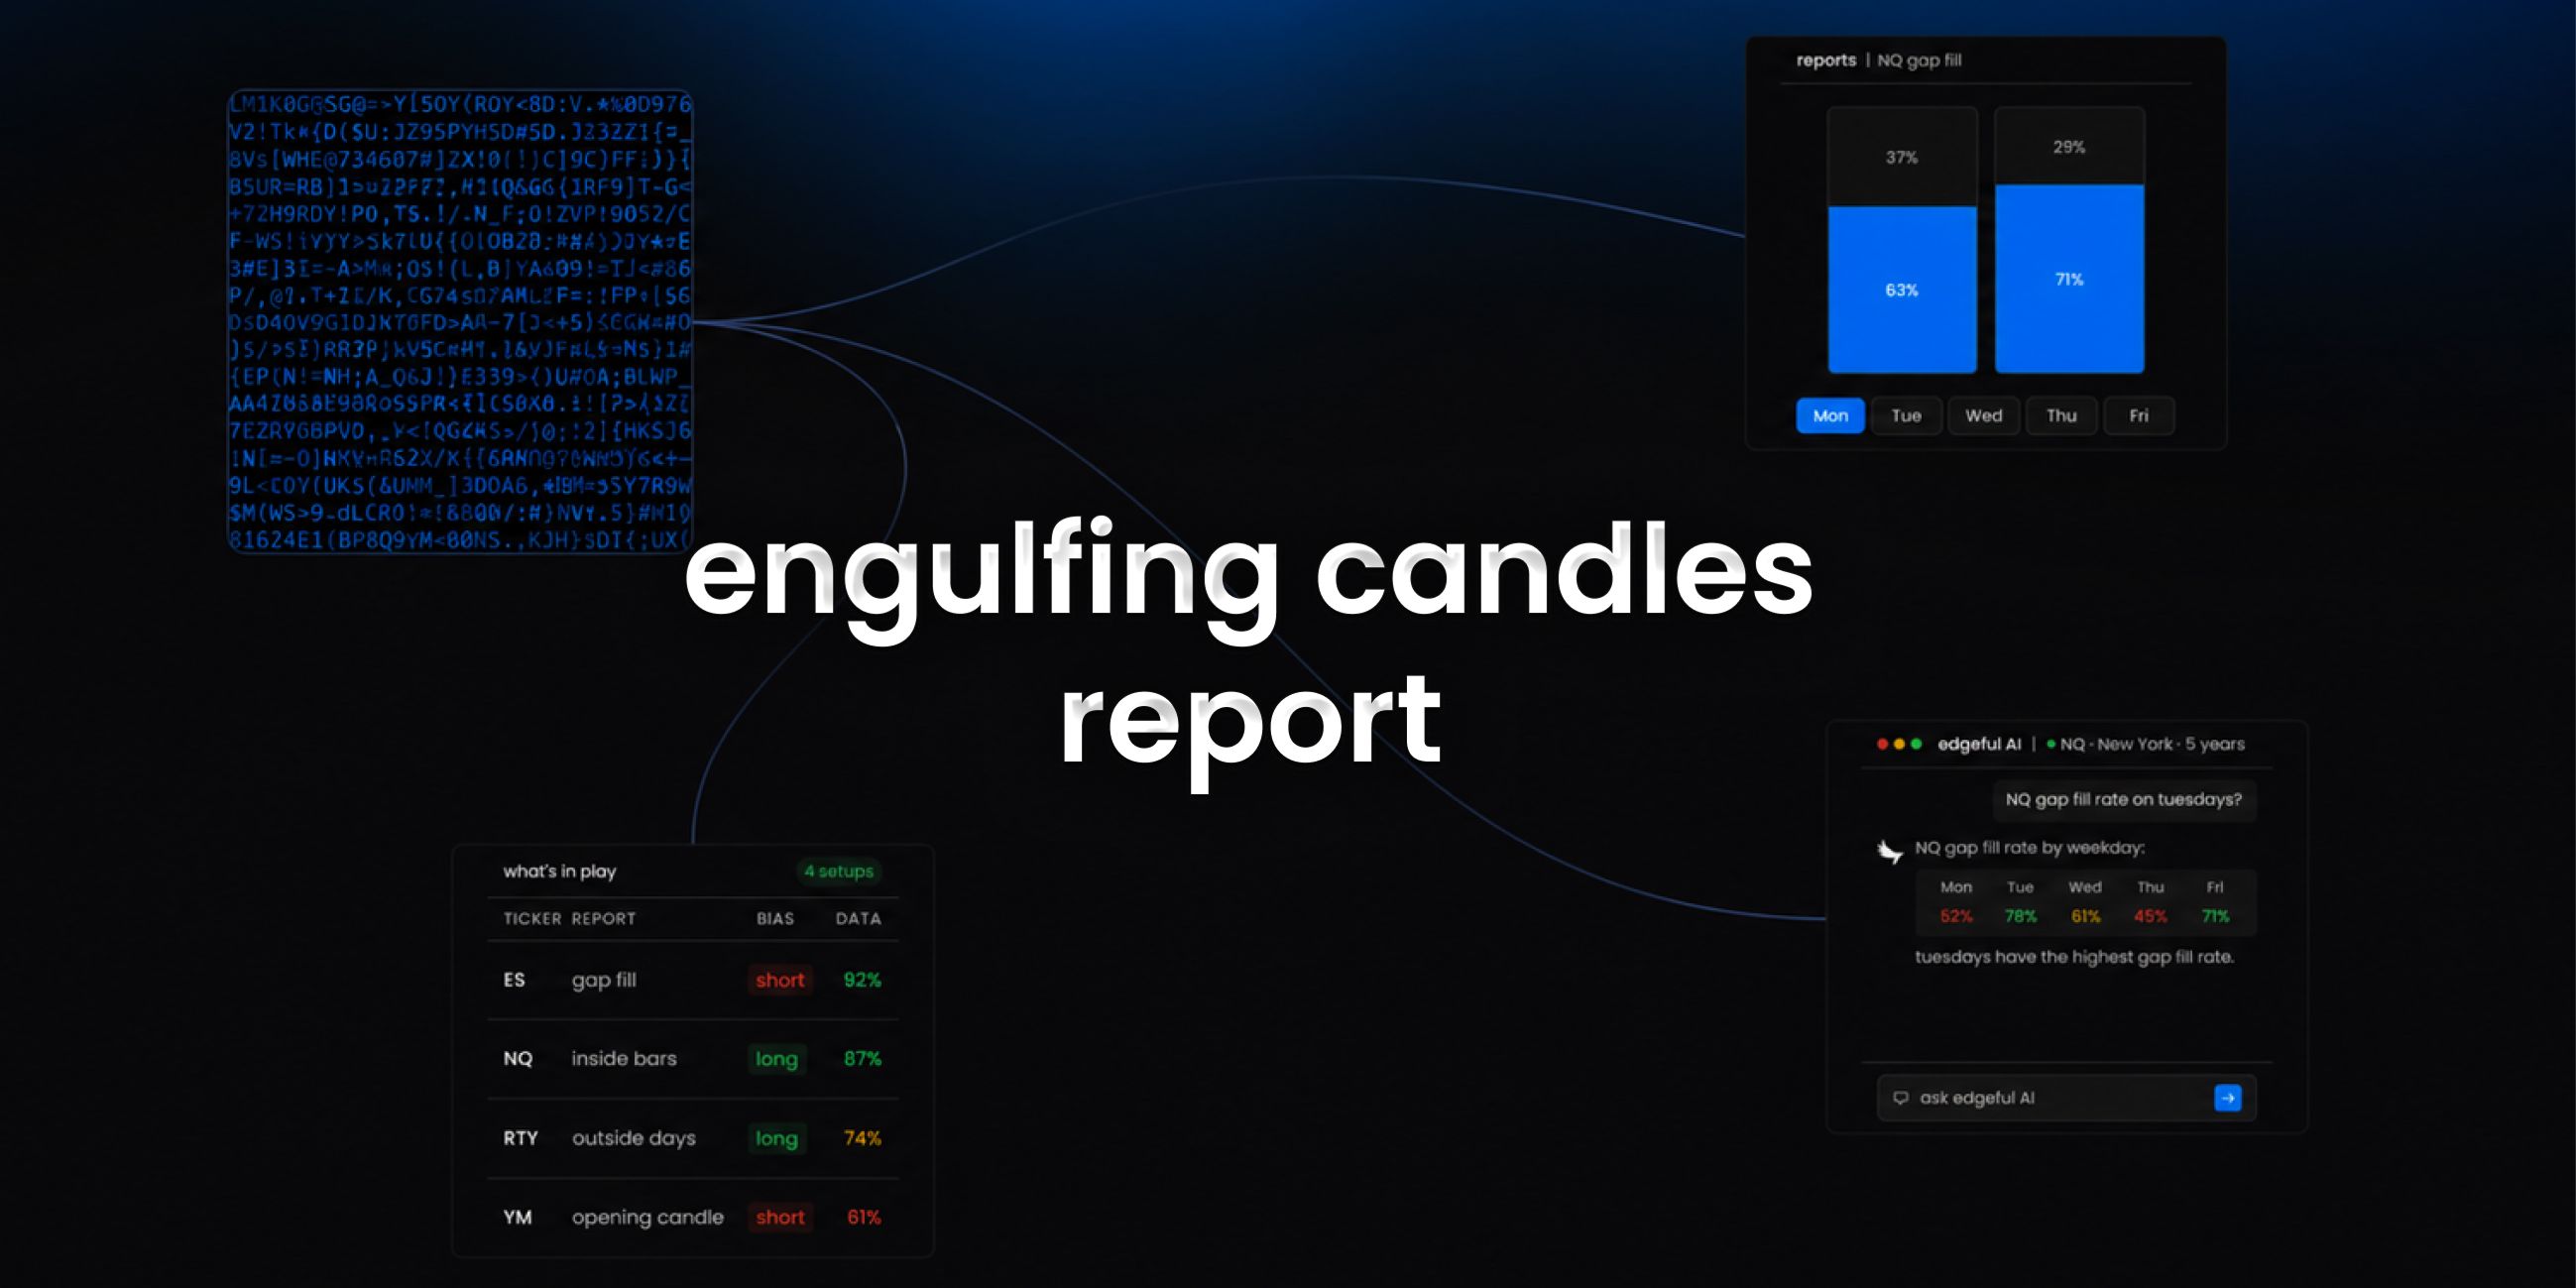
- use the what's in play dashboard to see engulfing candles data alongside your other favorite reports in one view
- the screener lets you scan up to 49 tickers for engulfing candles setups across 4 reports simultaneously
- edgeful AI can analyze engulfing candles data alongside other reports and find patterns you'd never spot manually
key takeaways
- the edgeful engulfing candles report measures identifies bullish and bearish engulfing candle patterns by comparing consecutive candlesticks where the current candle completely engulfs the previous candle body. calculates performance statistics by tracking price movement from pattern formation until invalidation or end of trading session, measuring both absolute and percentage returns for each pattern type.
- available for futures, stocks, ETFs, forex, and crypto with full session, ticker, and date range filtering
- 3 subreports available: by daily candle, by rr, by size
- part of the 150+ reports included in the edgeful essential plan ($49/month or $39/month annual)
- works best when combined with other reports using what's in play, the screener, or edgeful AI
trading involves risk. past performance and historical data do not guarantee future results. the statistics referenced in this post are based on historical data and may not reflect future market conditions. always trade with proper risk management.