earnings performance report: what it measures and how traders use it
the earnings performance report on edgeful calculates price percentage changes during the pre-earnings, earnings day, and post-earnings periods. it processes historical close prices alongside earnings dates to compute average performance across all three periods.
you get aggregated statistics and individual breakdowns for each earnings event, so you can see how price tends to behave before, during, and after earnings.
this is one of the 150+ reports available on the edgeful platform. here's how it works, what the data shows, and how traders use it.
table of contents
- what the earnings performance report measures
- how the calculation works
- how traders use earnings performance data
- combining earnings performance with other reports
- key takeaways
what the earnings performance report measures
the earnings performance report calculates price percentage changes during the pre-earnings, earnings day, and post-earnings periods. it processes historical close prices alongside earnings dates to compute average performance across all three periods.
the report is available for stocks and ETFs that report earnings. you can filter by ticker and lookback period.
how the calculation works
the earnings performance report aggregates returns across earnings cycles.
- the report identifies each earnings announcement date over the lookback period
- it calculates returns over multiple windows surrounding each event (pre-event, event-day, post-event)
- averages are computed across all earnings cycles for the ticker
- separate stats are produced for each window so traders can see different time horizons
- this gives you a statistical view of how a given ticker tends to behave around its earnings cycle
how traders use earnings performance data
- preparing for earnings cycles by knowing the historical pre- and post-event tendencies
- avoiding holding into earnings on tickers that historically gap reverse
- timing entries after earnings based on average post-event drift
- pairing with seasonality and performance trends for longer-horizon context
- risk management by reducing size around event days
the data doesn't tell you to trade. the earnings performance report tells you the historical performance of the setup in front of you. what you do with that information is your decision.
results require customization, time, and effort. the numbers change depending on your ticker, session, and lookback period. always check the data for your specific conditions.
combining earnings performance with other reports
the earnings performance report works best when combined with other edgeful reports for confluence:
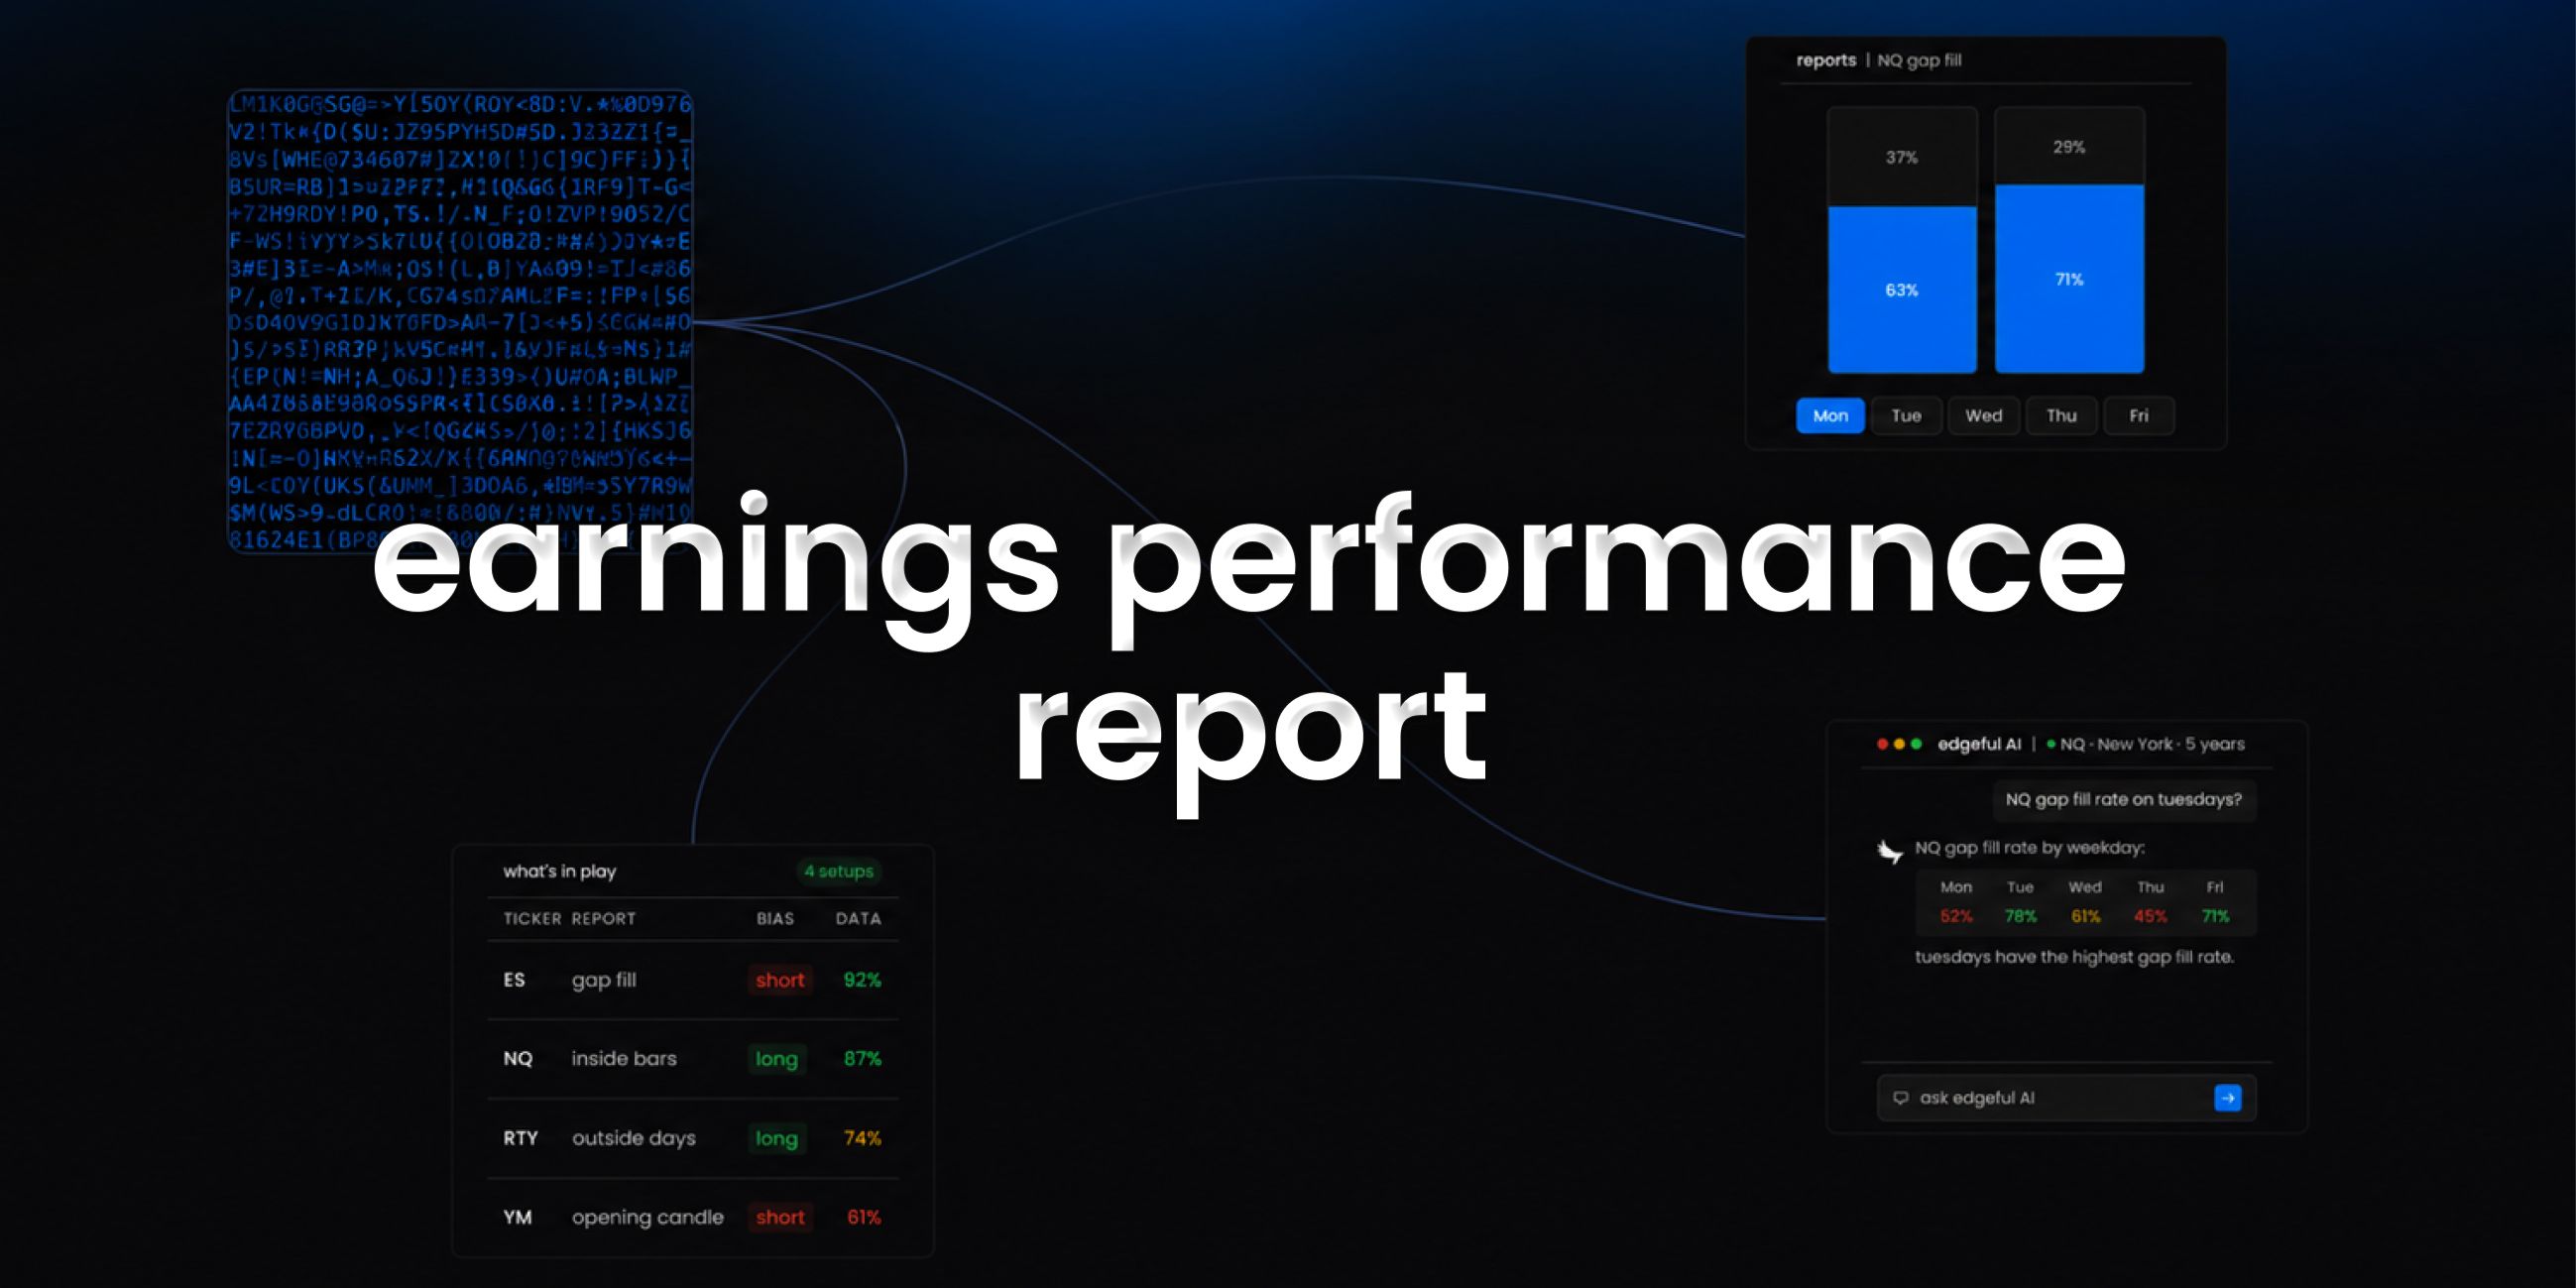
- use the what's in play dashboard to see earnings performance data alongside your other favorite reports in one view
- the screener lets you scan up to 49 tickers for earnings performance setups across 4 reports simultaneously
- edgeful AI can analyze earnings performance data alongside other reports and find patterns you'd never spot manually
key takeaways
- the edgeful earnings performance report measures price behavior across earnings cycles over multiple windows
- available for stocks and ETFs that report earnings, with ticker and lookback filtering
- part of the 150+ reports included in the edgeful essential plan ($49/month or $39/month annual)
- works best when combined with other reports using what's in play, the screener, or edgeful AI
trading involves risk. past performance and historical data do not guarantee future results. the statistics referenced in this post are based on historical data and may not reflect future market conditions. always trade with proper risk management.