asian range breakout report: what it measures and how traders use it
the asian range breakout report on edgeful analyzes price breakouts above or below the Asian trading session high/low range and correlates them with daily candle colors (green for positive daily returns, red for negative). Tracks frequency and percentages of breakouts that result in green versus red daily candles to identify directional bias patterns after Asian range violations.
this is one of the 150+ reports available on the edgeful platform. here's how it works, what the data shows, and how traders use it.
table of contents
- what the asian range breakout report measures
- how the calculation works
- available subreports
- how traders use asian range breakout data
- combining asian range breakout with other reports
- key takeaways
what the asian range breakout report measures
this report analyzes price breakouts above or below the Asian trading session high/low range and correlates them with daily candle colors (green for positive daily returns, red for negative). it tracks the frequency and percentages of breakouts that result in green versus red daily candles to identify directional bias patterns after Asian range violations.
the report is available for futures, stocks, ETFs, forex, and crypto. you can filter by ticker, session (NY, London, Asian, full globex, or custom), and lookback period (1 month to 5+ years).
how the calculation works
according to edgeful data, the asian range breakout report follows a specific calculation process:
the asian range breakout report identifies the high and low of the asian trading session, then tracks what happens when price breaks beyond that range during the rest of the trading day.
- the report establishes the asian session high and low as the reference range
- it monitors subsequent price action for breaks above the high or below the low
- when a breakout occurs, it records the direction and whether the daily candle closed green or red
- percentages are calculated for how often breakouts occur in each direction and what percentage result in green vs red daily closes
- this gives you a statistical breakdown of directional bias after asian range violations
available subreports
the asian range breakout report has 3 subreports for deeper analysis:
- by close. analyzes breakout patterns from Asian trading session ranges by tracking when price first closes above or below the Asian high/low and comparing it to the daily closing price. Calculates statistics on breakout frequency and whether the daily close remains above/below the breakout level.
- by extension. calculates how much prices extend beyond Asian session highs and lows during subsequent trading sessions.
- by weekday. analyzes trading patterns when price breaks above Asian session high or below Asian session low during the rest of the trading day, categorized by weekday.
how traders use asian range breakout data
- identifying directional bias after Asian range breakouts to determine higher probability trade directions
- setting position sizing based on historical success rates of breakouts resulting in favorable daily closes
- timing entries by waiting for Asian range violations before taking directional positions
- risk management by avoiding counter-trend trades when breakout statistics show strong directional bias
- strategy validation by comparing live breakout performance against historical percentages
the data doesn't tell you to trade. the asian range breakout report tells you the historical performance of the setup in front of you. what you do with that information is your decision.
results require customization, time, and effort. the numbers change depending on your ticker, session, and lookback period. always check the data for your specific conditions.
combining asian range breakout with other reports
the asian range breakout report works best when combined with other edgeful reports for confluence:
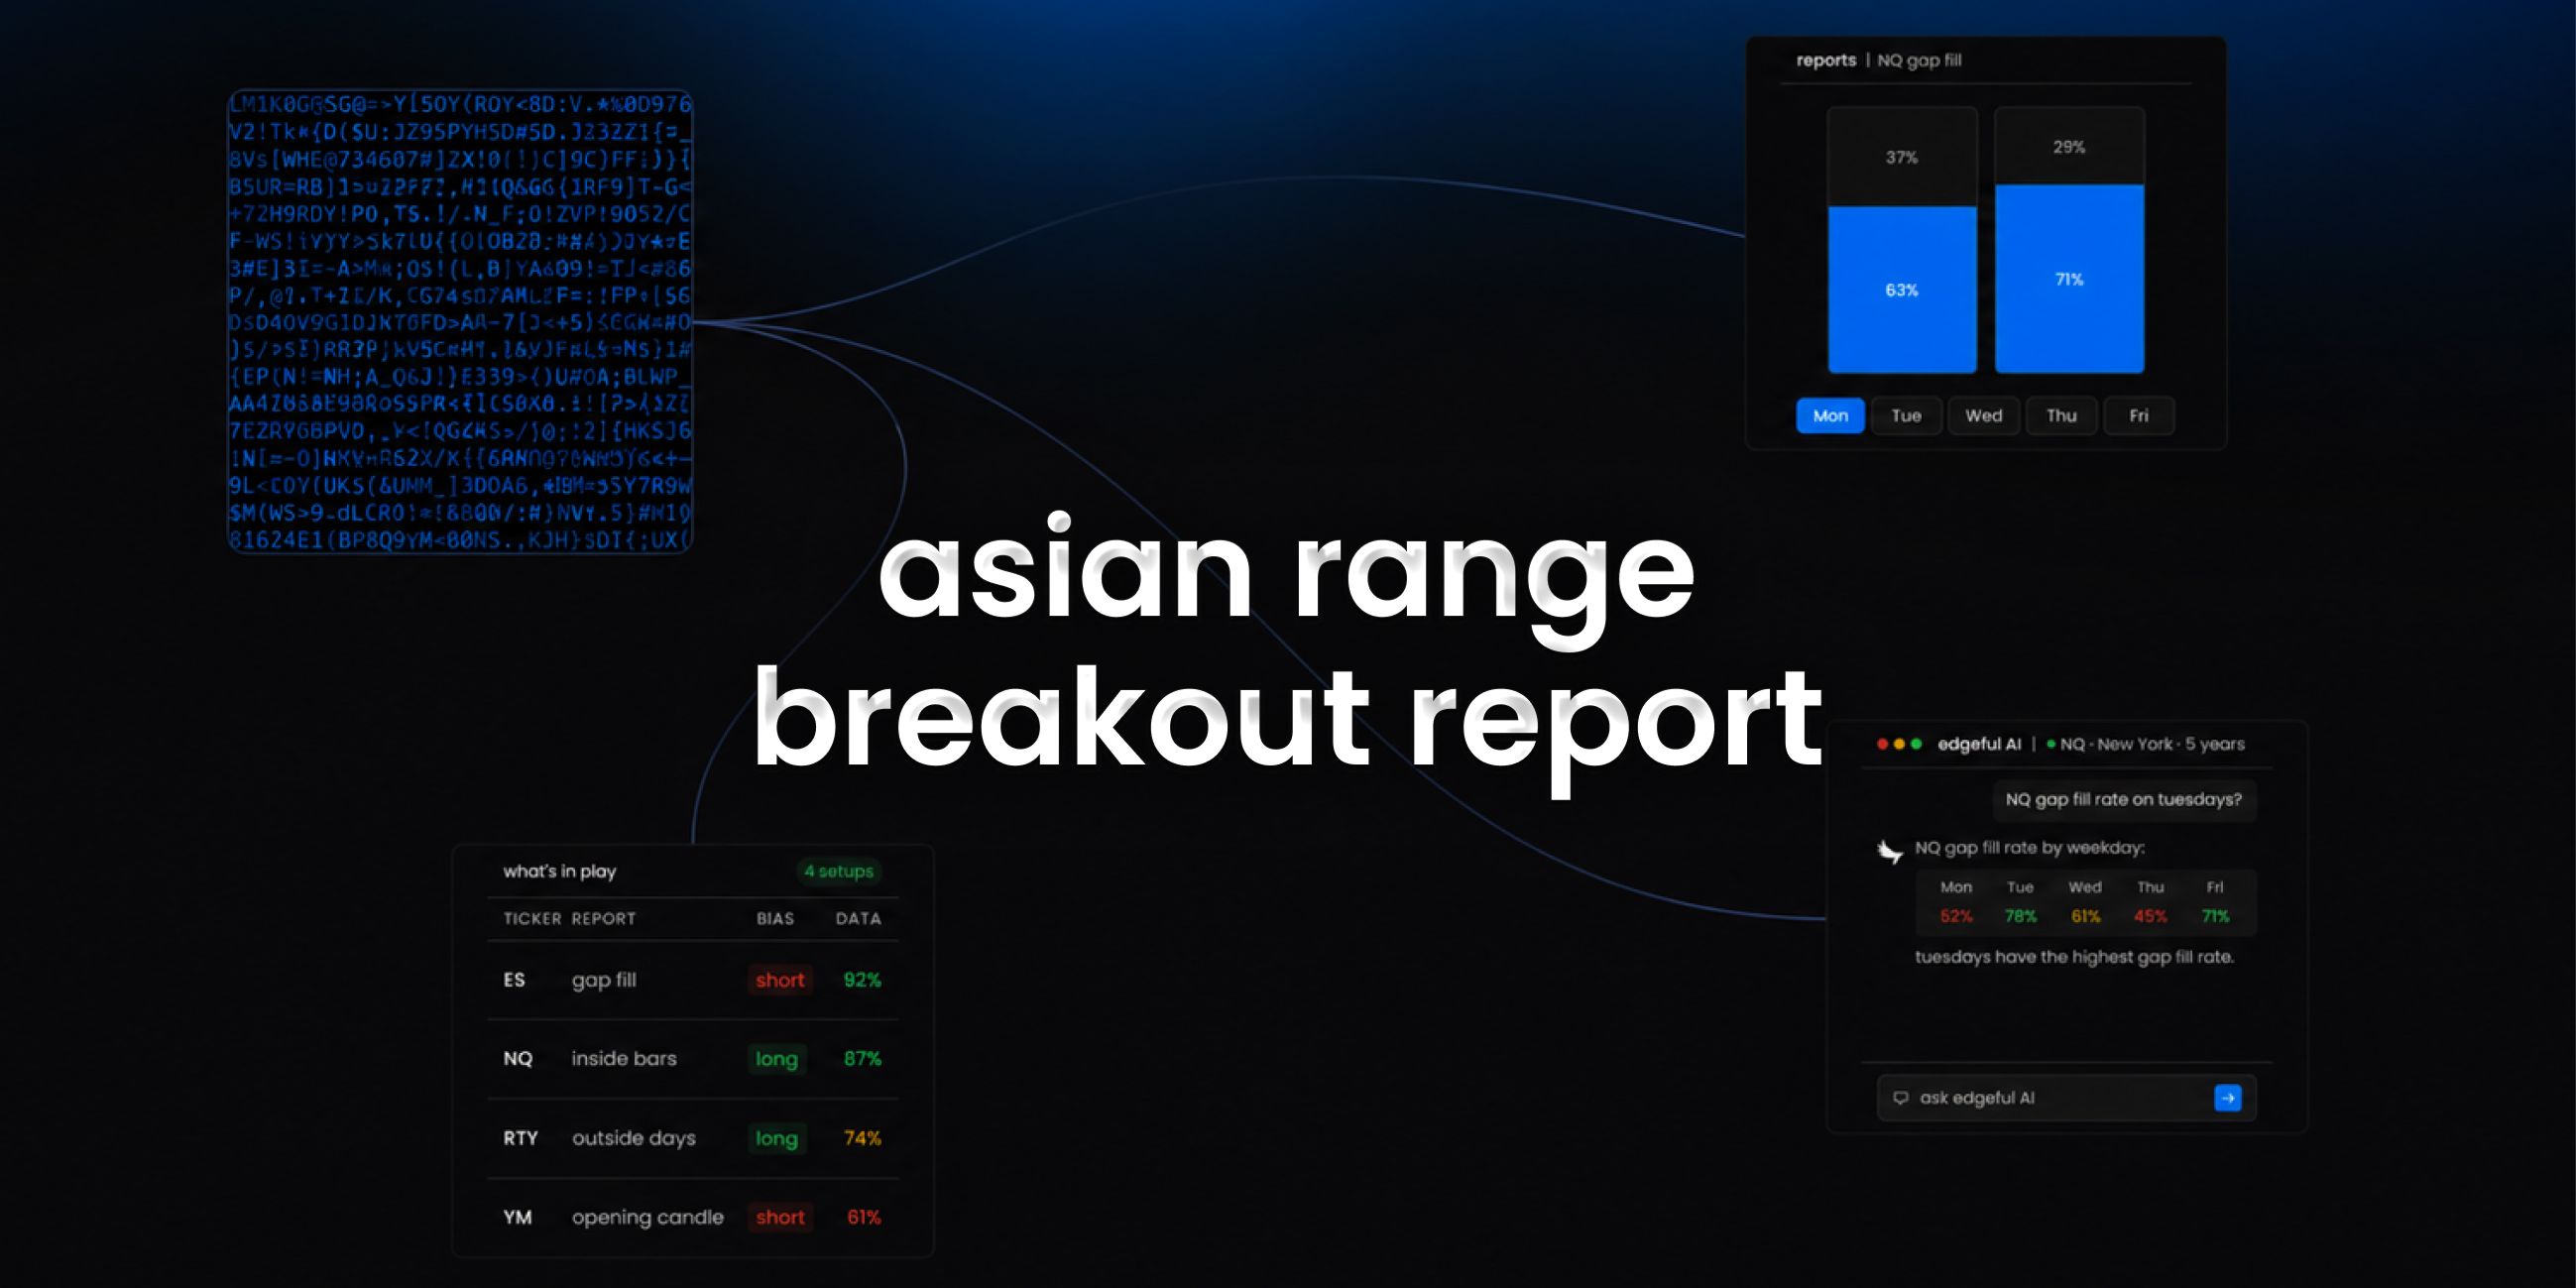
- use the what's in play dashboard to see asian range breakout data alongside your other favorite reports in one view
- the screener lets you scan up to 49 tickers for asian range breakout setups across 4 reports simultaneously
- edgeful AI can analyze asian range breakout data alongside other reports and find patterns you'd never spot manually
key takeaways
- the edgeful asian range breakout report measures analyzes price breakouts above or below the asian trading session high/low range and correlates them with daily candle colors (green for positive daily returns, red for negative). tracks frequency and percentages of breakouts that result in green versus red daily candles to identify directional bias patterns after asian range violations.
- available for futures, stocks, ETFs, forex, and crypto with full session, ticker, and date range filtering
- 3 subreports available: by close, by extension, by weekday
- part of the 150+ reports included in the edgeful essential plan ($49/month or $39/month annual)
- works best when combined with other reports using what's in play, the screener, or edgeful AI
trading involves risk. past performance and historical data do not guarantee future results. the statistics referenced in this post are based on historical data and may not reflect future market conditions. always trade with proper risk management.