ICT opening retracement report: what it measures and how traders use it
the ICT opening retracement report on edgeful analyzes historical price data to determine whether trading sessions opened above or below a comparison candle level and whether prices retraced back to that level afterward.
this is one of the 150+ reports available on the edgeful platform. here's how it works, what the data shows, and how traders use it.
table of contents
- what the ICT opening retracement report measures
- how the calculation works
- available subreports
- how traders use ICT opening retracement data
- combining ICT opening retracement with other reports
- key takeaways
what the ICT opening retracement report measures
the ICT opening retracement report analyzes historical price data to determine whether trading sessions opened above or below a comparison candle level and whether prices retraced back to that level afterward.
the report is available for futures, stocks, ETFs, forex, and crypto. you can filter by ticker, session (NY, London, Asian, full globex, or custom), and lookback period (1 month to 5+ years).
how the calculation works
according to edgeful data, the ICT opening retracement report follows a specific calculation process:
the ICT opening retracement report tracks how price interacts with a key reference level after the session opens.
- the report checks whether the session opens above or below the comparison candle level
- for sessions opening above, it measures how often price retraces down to test that level
- for sessions opening below, it measures how often price retraces up to test that level
- percentages are calculated for retracement frequency in both directions, giving you a statistical read on how likely price is to retrace to the reference level
available subreports
the ICT opening retracement report has 3 subreports for deeper analysis:
by fill time. analyzes historical intraday data to calculate statistics on when price retraces back to comparison candle levels after session open.
by size. analyzes opening gaps relative to a comparison candle and categorizes them into seven size ranges from less than 0.1% to 1.5% and above. Tracks whether sessions open above or below the comparison candle and whether they subsequently retrace back to that level, providing frequency counts and percentages for each size category.
by weekday. analyzes how price opens relative to a compare candle level and tracks whether price retraces back to that level, categorized by weekday.
how traders use ICT opening retracement data
- identifying market bias based on session opening direction relative to key reference levels
- measuring retracement probability for sessions opening above or below specific price levels
- setting expectations for price action based on opening gap patterns and historical retracement rates
- risk assessment for trades taken when sessions open away from reference candles
- timing entries based on retracement likelihood after gap openings
the data doesn't tell you to trade. the ICT opening retracement report tells you the historical performance of the setup in front of you. what you do with that information is your decision.
results require customization, time, and effort. the numbers change depending on your ticker, session, and lookback period. always check the data for your specific conditions.
combining ICT opening retracement with other reports
the ICT opening retracement report works best when combined with other edgeful reports for confluence:
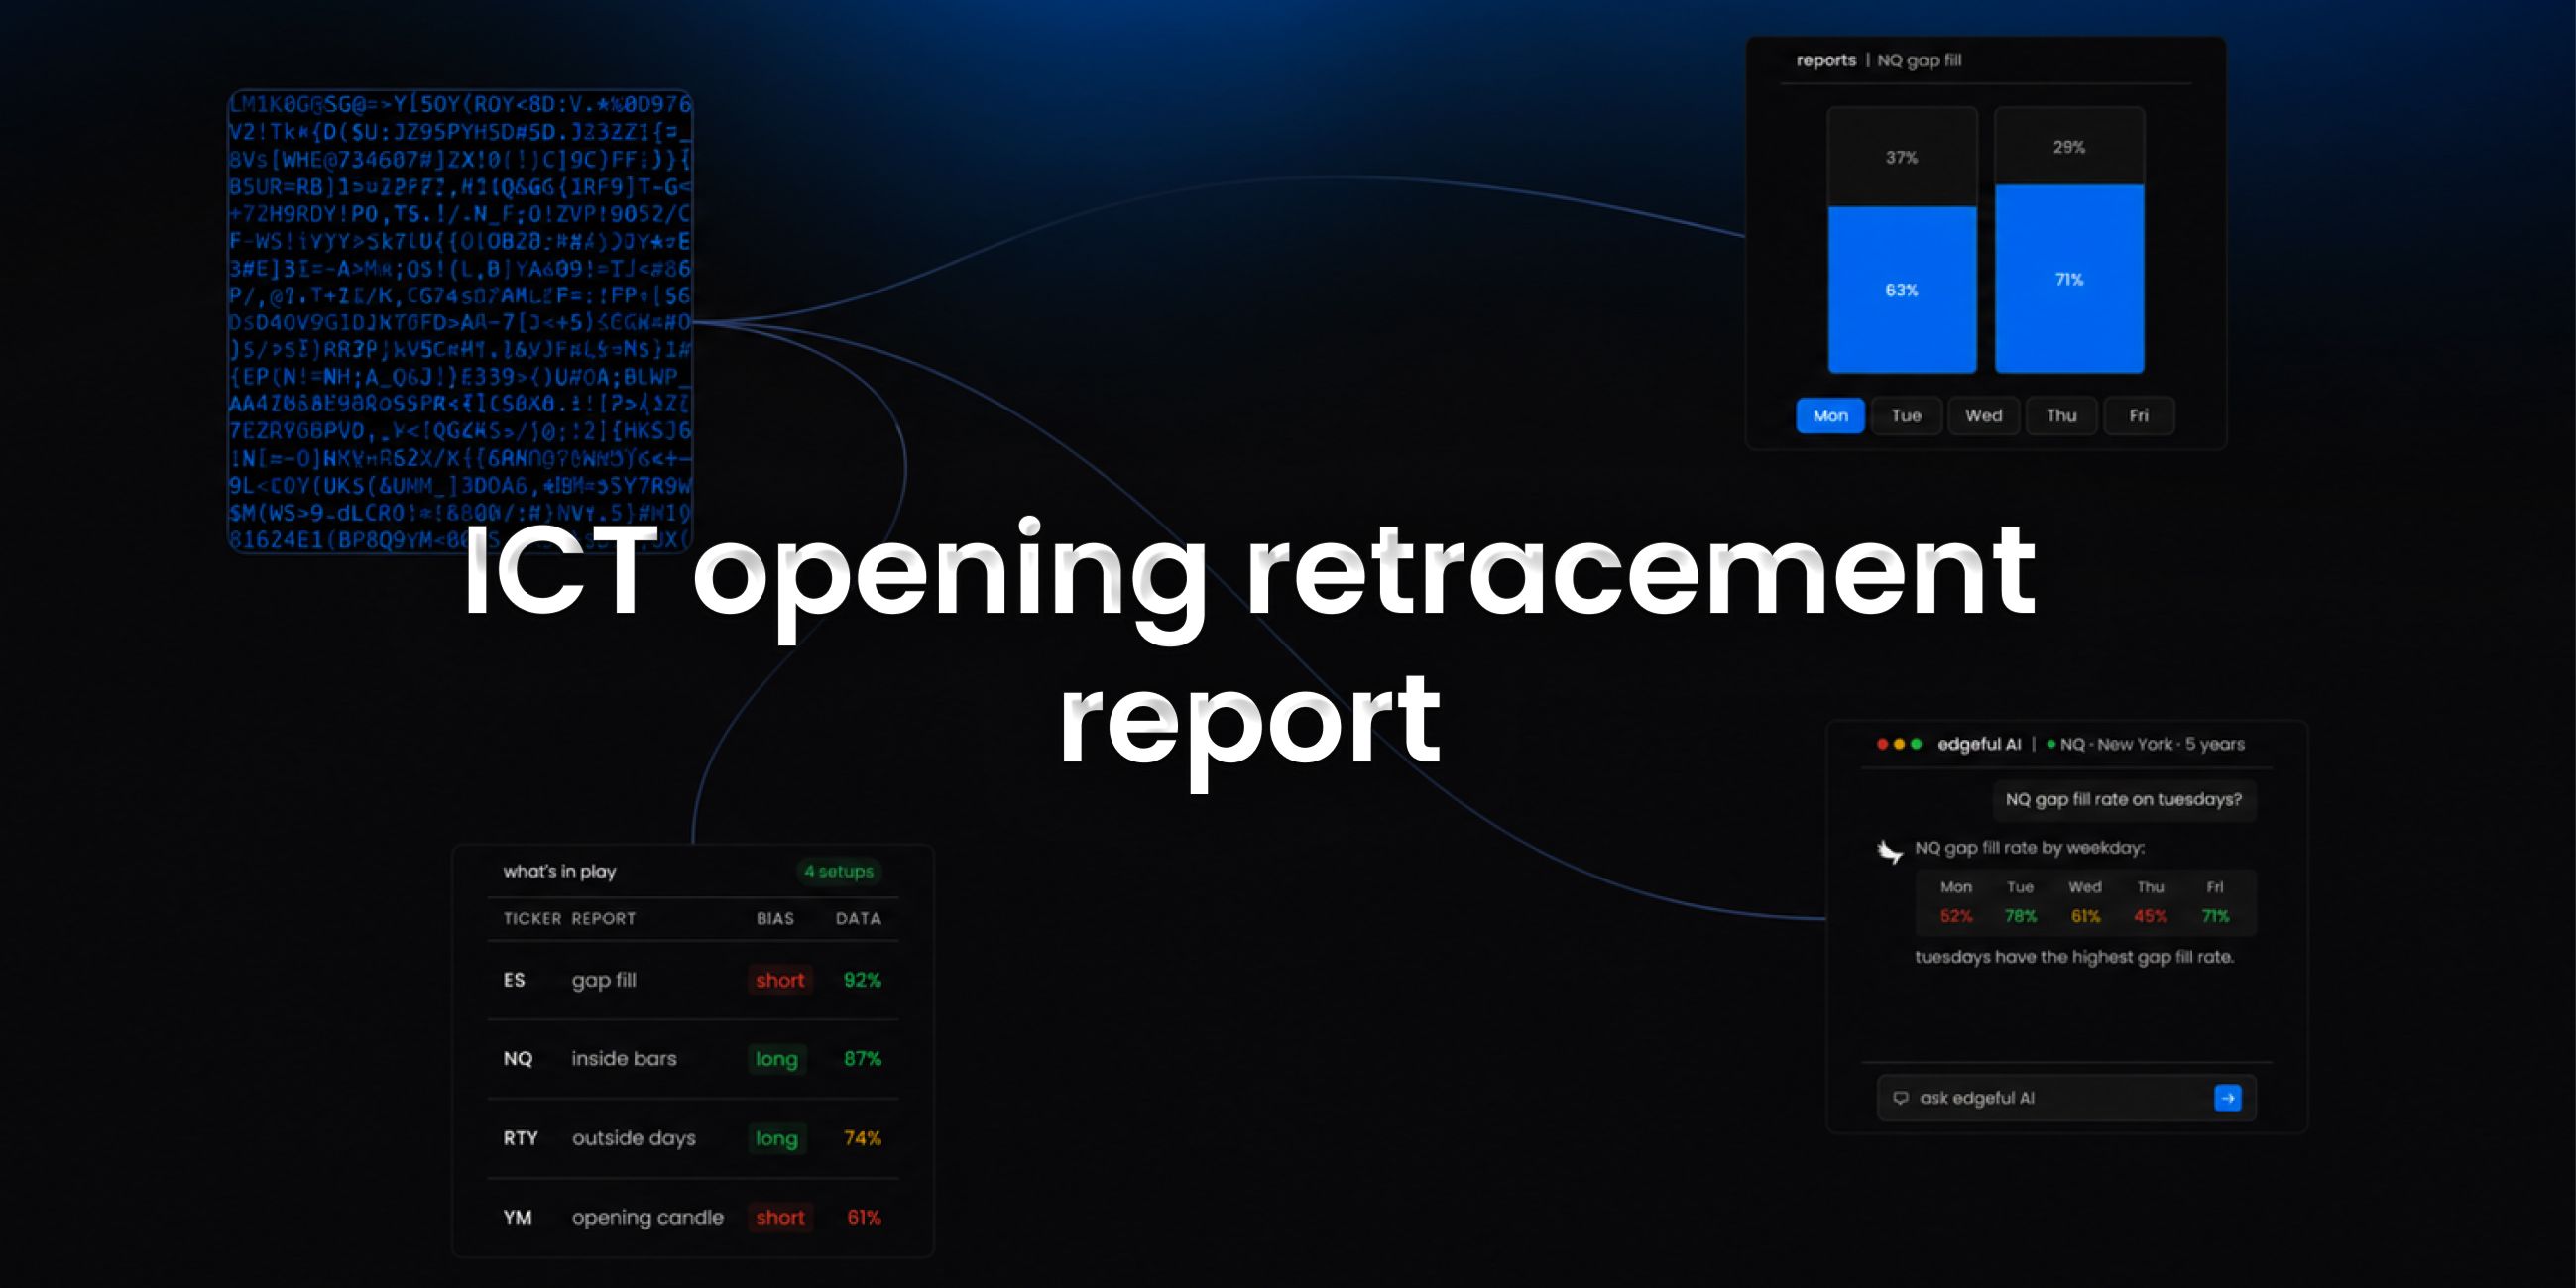
- use the what's in play dashboard to see ICT opening retracement data alongside your other favorite reports in one view
- the screener lets you scan up to 49 tickers for ICT opening retracement setups across 4 reports simultaneously
- edgeful AI can analyze ICT opening retracement data alongside other reports and find patterns you'd never spot manually
key takeaways
- the edgeful ICT opening retracement report measures analyzes historical price data to determine whether trading sessions opened above or below a comparison candle level and whether prices subsequently retraced back to that level. calculates frequency counts and percentages for opening patterns and retracement behaviors, tracking both upward and downward price movements relative to the reference candle.
- available for futures, stocks, ETFs, forex, and crypto with full session, ticker, and date range filtering
- 3 subreports available: by fill time, by size, by weekday
- part of the 150+ reports included in the edgeful essential plan ($49/month or $39/month annual)
- works best when combined with other reports using what's in play, the screener, or edgeful AI
trading involves risk. past performance and historical data do not guarantee future results. the statistics referenced in this post are based on historical data and may not reflect future market conditions. always trade with proper risk management.