price action trading: how to read raw charts and make better decisions with data
price action trading is the purest form of technical analysis. no indicators, no oscillators, no overlays — just the raw price chart telling you what buyers and sellers are doing in real time.
all you have to do is focus on what actually matters: where price is, where it came from, and where it's likely to go. every indicator is derived from price anyway, so why not go straight to the source?
but here's where price action trading gets tricky. reading a chart is subjective. two traders can look at the same candles and come to completely different conclusions. that subjectivity is what makes price action powerful in the right hands and unreliable in the wrong ones.
the difference, in our experience, is data. price action tells you what the market is doing right now. data tells you what's likely to happen next based on how similar conditions have played out historically. combining the two gives you something neither one provides alone: a framework that's both responsive and grounded.
table of contents
- what is price action trading
- why traders choose price action over indicators
- the building blocks of price action
- key price action patterns for day traders
- reading price action in real time: a practical framework
- price action + data: why raw charts aren't enough
- how to use edgeful data to validate price action reads
- building a price action trading routine
- common mistakes with price action trading
- key takeaways
what is price action trading
price action trading is making trading decisions based on the movement of price itself — without relying on lagging indicators like MACD, RSI, or moving averages.
price action traders read candles, chart structure, support and resistance levels, and the flow of highs and lows to understand what the market is doing and anticipate what it might do next.
the core philosophy: everything you need to know is in the price chart. indicators are just derivatives of price, so they're always a step behind. if you can read the raw chart, you're looking at the most current information available.
this doesn't mean indicators are useless. plenty of profitable traders use them. but price action traders believe the chart itself is the most direct source of information, and they build their entire decision-making process around it.
why traders choose price action over indicators
- no lag. indicators process historical data and output a delayed signal. price is real-time. by the time an RSI divergence "confirms," the move may already be underway
- simplicity. a clean chart with just candles and a few key levels is easier to read than a chart with 5 indicators overlapping each other. less noise, more clarity
- universal application. price action works on any instrument, any timeframe, any market. the same patterns appear on ES, NQ, GC, forex, crypto — because they reflect human behavior, which doesn't change
- adaptability. indicators break in certain conditions (trending vs ranging, high vs low volatility). price action readers adjust based on what the chart is showing them right now, not what an indicator is calculating from the past
the tradeoff: price action requires more screen time, more practice, and more subjectivity than indicator-based trading. there's no mechanical "buy when the line crosses" signal. you're reading context, and that takes experience.
the building blocks of price action
before you can trade price action, you need to understand the foundational elements.
candlestick structure
individual candles tell you what happened during a specific time period:
- the body shows the open-to-close range. a green (bullish) body means the close was above the open. a red (bearish) body means the close was below
- the wicks show the full range — how far price traveled beyond the body in each direction. long wicks indicate rejection. a long lower wick means sellers pushed price down but buyers brought it back
specific candlestick patterns — engulfing bars, pin bars, doji candles, inside bars — carry meaning for price action traders. for a full breakdown of candlestick patterns and their effectiveness, see our candlestick patterns guide.
market structure: highs and lows
the sequence of highs and lows tells you the trend:
- uptrend: higher highs and higher lows. each rally goes further than the last, and each pullback holds above the previous low
- downtrend: lower highs and lower lows. each drop goes further than the last, and each rally fails below the previous high
- range: highs and lows are roughly equal. price is bouncing between support and resistance without a clear directional bias
a trend change happens when the pattern breaks — when a higher low in an uptrend fails and price makes a lower low instead. that's a structural shift that price action traders pay close attention to.
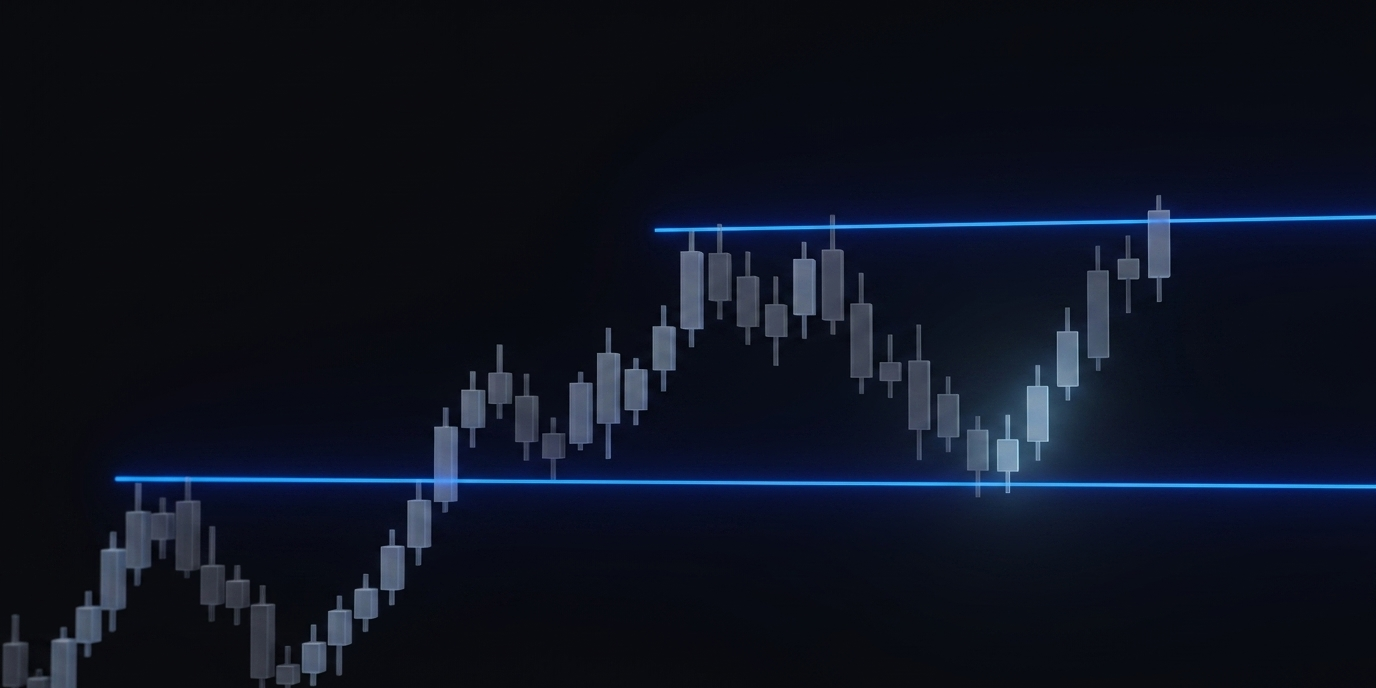
support and resistance
support is where price has found buyers. resistance is where price has found sellers. these levels become reference points for trading decisions:
- a bounce off support is a potential long entry
- a rejection at resistance is a potential short entry
- a break through support or resistance signals a potential continuation
price action traders draw these levels from obvious prior highs, prior lows, and areas where price has spent time consolidating. the best levels are the ones that are obvious — if you have to squint to see it, it's probably not a meaningful level.
volume as confirmation
while price action purists focus exclusively on candles and structure, volume adds a useful layer. a breakout with high volume is more likely to follow through than one on thin volume. a trend supported by increasing volume is stronger than one where volume is fading.
in futures trading, volume is readily available and can be a quick gut check on any price action read.
key price action patterns for day traders
these are the patterns price action traders use most often in day trading:
engulfing bars
a candle that completely engulfs the previous candle's range. a bullish engulfing bar at support suggests buyers have taken over. a bearish engulfing bar at resistance suggests sellers have stepped in.
edgeful tracks engulfing bar performance with the engulfing bars strategy report — showing you how often they follow through and what profit targets the data supports.
inside bars
an inside bar is a candle that trades entirely within the range of the previous candle. it represents consolidation — a contraction of range that often precedes an expansion. price action traders watch for the breakout direction from the inside bar.
for the full data on inside bar performance, see our inside bar strategy guide.
pin bars (rejection candles)
a candle with a long wick and a small body — indicating that price was pushed in one direction but rejected back. a pin bar at a key level is one of the strongest price action signals. the long wick shows that the level is being defended.
break of structure
when price breaks a prior swing high or low, it signals a potential shift in market structure. price action traders use break-of-structure (BOS) moves to identify trend changes and continuation patterns. a break of structure on a higher timeframe carries more weight than one on a lower timeframe.
double tops and double bottoms
classic reversal patterns where price tests a level twice and fails. we covered the triple top variation in our triple top guide — the same principles apply to double tops and bottoms.
reading price action in real time: a practical framework
reading a chart in real time is different from analyzing it after the fact. here's a framework that works:
1. identify the structure first
before looking at individual candles, zoom out and answer: are we in an uptrend, downtrend, or range? this is your bias. everything that follows should be evaluated against this structural context.
2. mark the key levels
draw the obvious support and resistance levels. prior highs, prior lows, areas of consolidation. also note the session levels: the opening range, the IB high and low, the overnight high and low. these are the levels that matter for the current session.
3. wait for price to reach a level
price action trading is about waiting, not chasing. the best setups happen when price arrives at a key level and shows a reaction. if price is in no-man's-land between levels, there's no edge.
4. look for a pattern at the level
when price reaches your level, what does it do? a strong rejection candle (pin bar, engulfing bar) at a key level is a higher-quality signal than price slowly drifting into the level with no clear reaction.
5. take the trade or pass
not every level produces a clean pattern. not every pattern at a level leads to a move. the best price action traders are selective — they pass on more setups than they take. the edge is in the quality of the setup, not the quantity.
price action + data: why raw charts aren't enough
here's where we add the layer that most price action resources skip.
price action tells you what the market is doing. but it doesn't tell you what the market has done historically in similar conditions. two different sessions can produce identical-looking chart setups but have completely different outcomes — because the underlying session data, the day of the week, and the time of day all affect follow-through.
this is where data bridges the gap.
if you see a bullish engulfing bar at the IB low on NQ during the NY session... that's a price action read. but what does the data say? how often does NQ reverse at the IB low? how often does the IB hold during this session? that's the kind of context that turns a subjective read into a data-informed decision.
price action traders who resist all forms of supplementary data are limiting themselves. the chart is primary — but the data is the context that tells you whether your read has historical support.
how to use edgeful data to validate price action reads
here are specific ways to layer data on top of your price action analysis:
validate support/resistance with session levels
if your price action analysis identifies a support level, check whether it aligns with a session level that edgeful tracks — the IB low, the opening range low, or the prior session close. overlap between your levels and session levels increases the significance of the zone.
check gap fill data for reversals near the open
if you see a bullish reversal pattern forming at the open and the overnight gap is down, check the gap fill report. if NQ gap downs fill 60%+ of the time, your bullish price action read has data support.
according to edgeful data, ES gap downs over the last 6 months in the NY session fill 67% of the time (34 out of 51 days). NQ gap downs fill 59% of the time (35 out of 59 days). that's the kind of data that turns a general price action trading idea into a specific, measurable setup.
use session breakout data for trade management
your price action read might tell you to get long. but how long do you hold? the power hour breakout report shows that ES and NQ only make new highs of day during the last hour (3:00-4:00 PM ET) about 21% of the time. if it's 2:45 PM and you're holding for a breakout, the data says that's a play that doesn't hit most days.
compare day-of-week data to your setup
a price action setup on a Thursday morning has different follow-through characteristics than the same setup on a Monday afternoon. ES Thursday NY range ($74.31) is 25% larger than Monday ($59.21). check the day-of-week data before deciding on your target.
for the full breakdown of how sessions affect setups: trading sessions guide. for day-of-week data: day of week strategy guide.
building a price action trading routine
- pre-market: set your levels. before the session opens, mark the prior day's high, low, and close. mark the overnight high and low. note the gap direction and size. these are your starting reference points
- first 30 minutes: observe the opening structure. watch how price interacts with your pre-market levels. does it immediately push through the overnight high? does it pull back toward the prior close? the opening behavior tells you a lot about the session's character
- identify the IB range. once the first 60 minutes complete, you have the initial balance. this becomes your primary reference range for the rest of the session. price action above the IB high = bullish. below the IB low = bearish. within the IB = range-bound
- wait for price to reach a key level + show a pattern. this is where the trade happens. price arrives at a level, shows a reaction (rejection candle, engulfing bar, break of structure), and you have data context supporting the move
- manage with data. use session breakout and time-of-day data to decide when to take profit. price action might say "hold" — but if the data says new session highs don't happen at this time, take the money
common mistakes with price action trading
mistake 1: seeing patterns everywhere
the human brain is wired to find patterns — even where they don't exist. not every candle at a level is a "signal." be selective. the best price action traders pass on 80% of setups because the context isn't right.
mistake 2: ignoring timeframe
a pin bar on a 1-minute chart means almost nothing. the same pin bar on a 15-minute or 1-hour chart at a key level is meaningful. always consider what timeframe you're reading. higher timeframes = more reliable patterns.
mistake 3: trading price action in a vacuum
reading the chart without knowing the session, the time of day, or the day of the week is trading without context. the chart tells you what's happening. the data tells you what's likely. use both.
mistake 4: not having clear rules
"i'll just read the chart and see what happens" isn't a strategy. define what patterns you trade, at what levels, under what conditions. price action is subjective by nature — having clear rules prevents that subjectivity from turning into inconsistency.
mistake 5: refusing to use any supporting data
some price action traders pride themselves on using nothing but the raw chart. that's fine as a philosophy — but if you have access to data that shows how often price fills the gap, how often the IB breaks and continues, or how the session typically behaves... why would you ignore it? the chart is primary. the data is supplementary. using both is just better.
key takeaways
- price action trading is reading the raw chart — candles, structure, levels — without relying on lagging indicators
- the building blocks are candlestick patterns, market structure (highs/lows), and support/resistance
- the best setups happen when price reaches a key level and shows a clear reaction pattern (engulfing bar, pin bar, break of structure)
- price action alone is subjective. combining it with session data, gap fill data, and time-of-day context from edgeful makes your reads more reliable
- selectivity is the edge — the best price action traders pass on more setups than they take
- build a routine: set pre-market levels, observe the opening structure, identify the IB range, wait for setups at key levels with data support
- chart patterns, candlestick signals, and structural breaks all work better when you know the underlying data supports the move
edgeful provides historical performance data to help traders make informed decisions. this does not constitute financial advice. past performance is not indicative of future results. all trading involves risk — always do your own analysis and manage your risk accordingly.