
do the first three candles predict the NQ close?
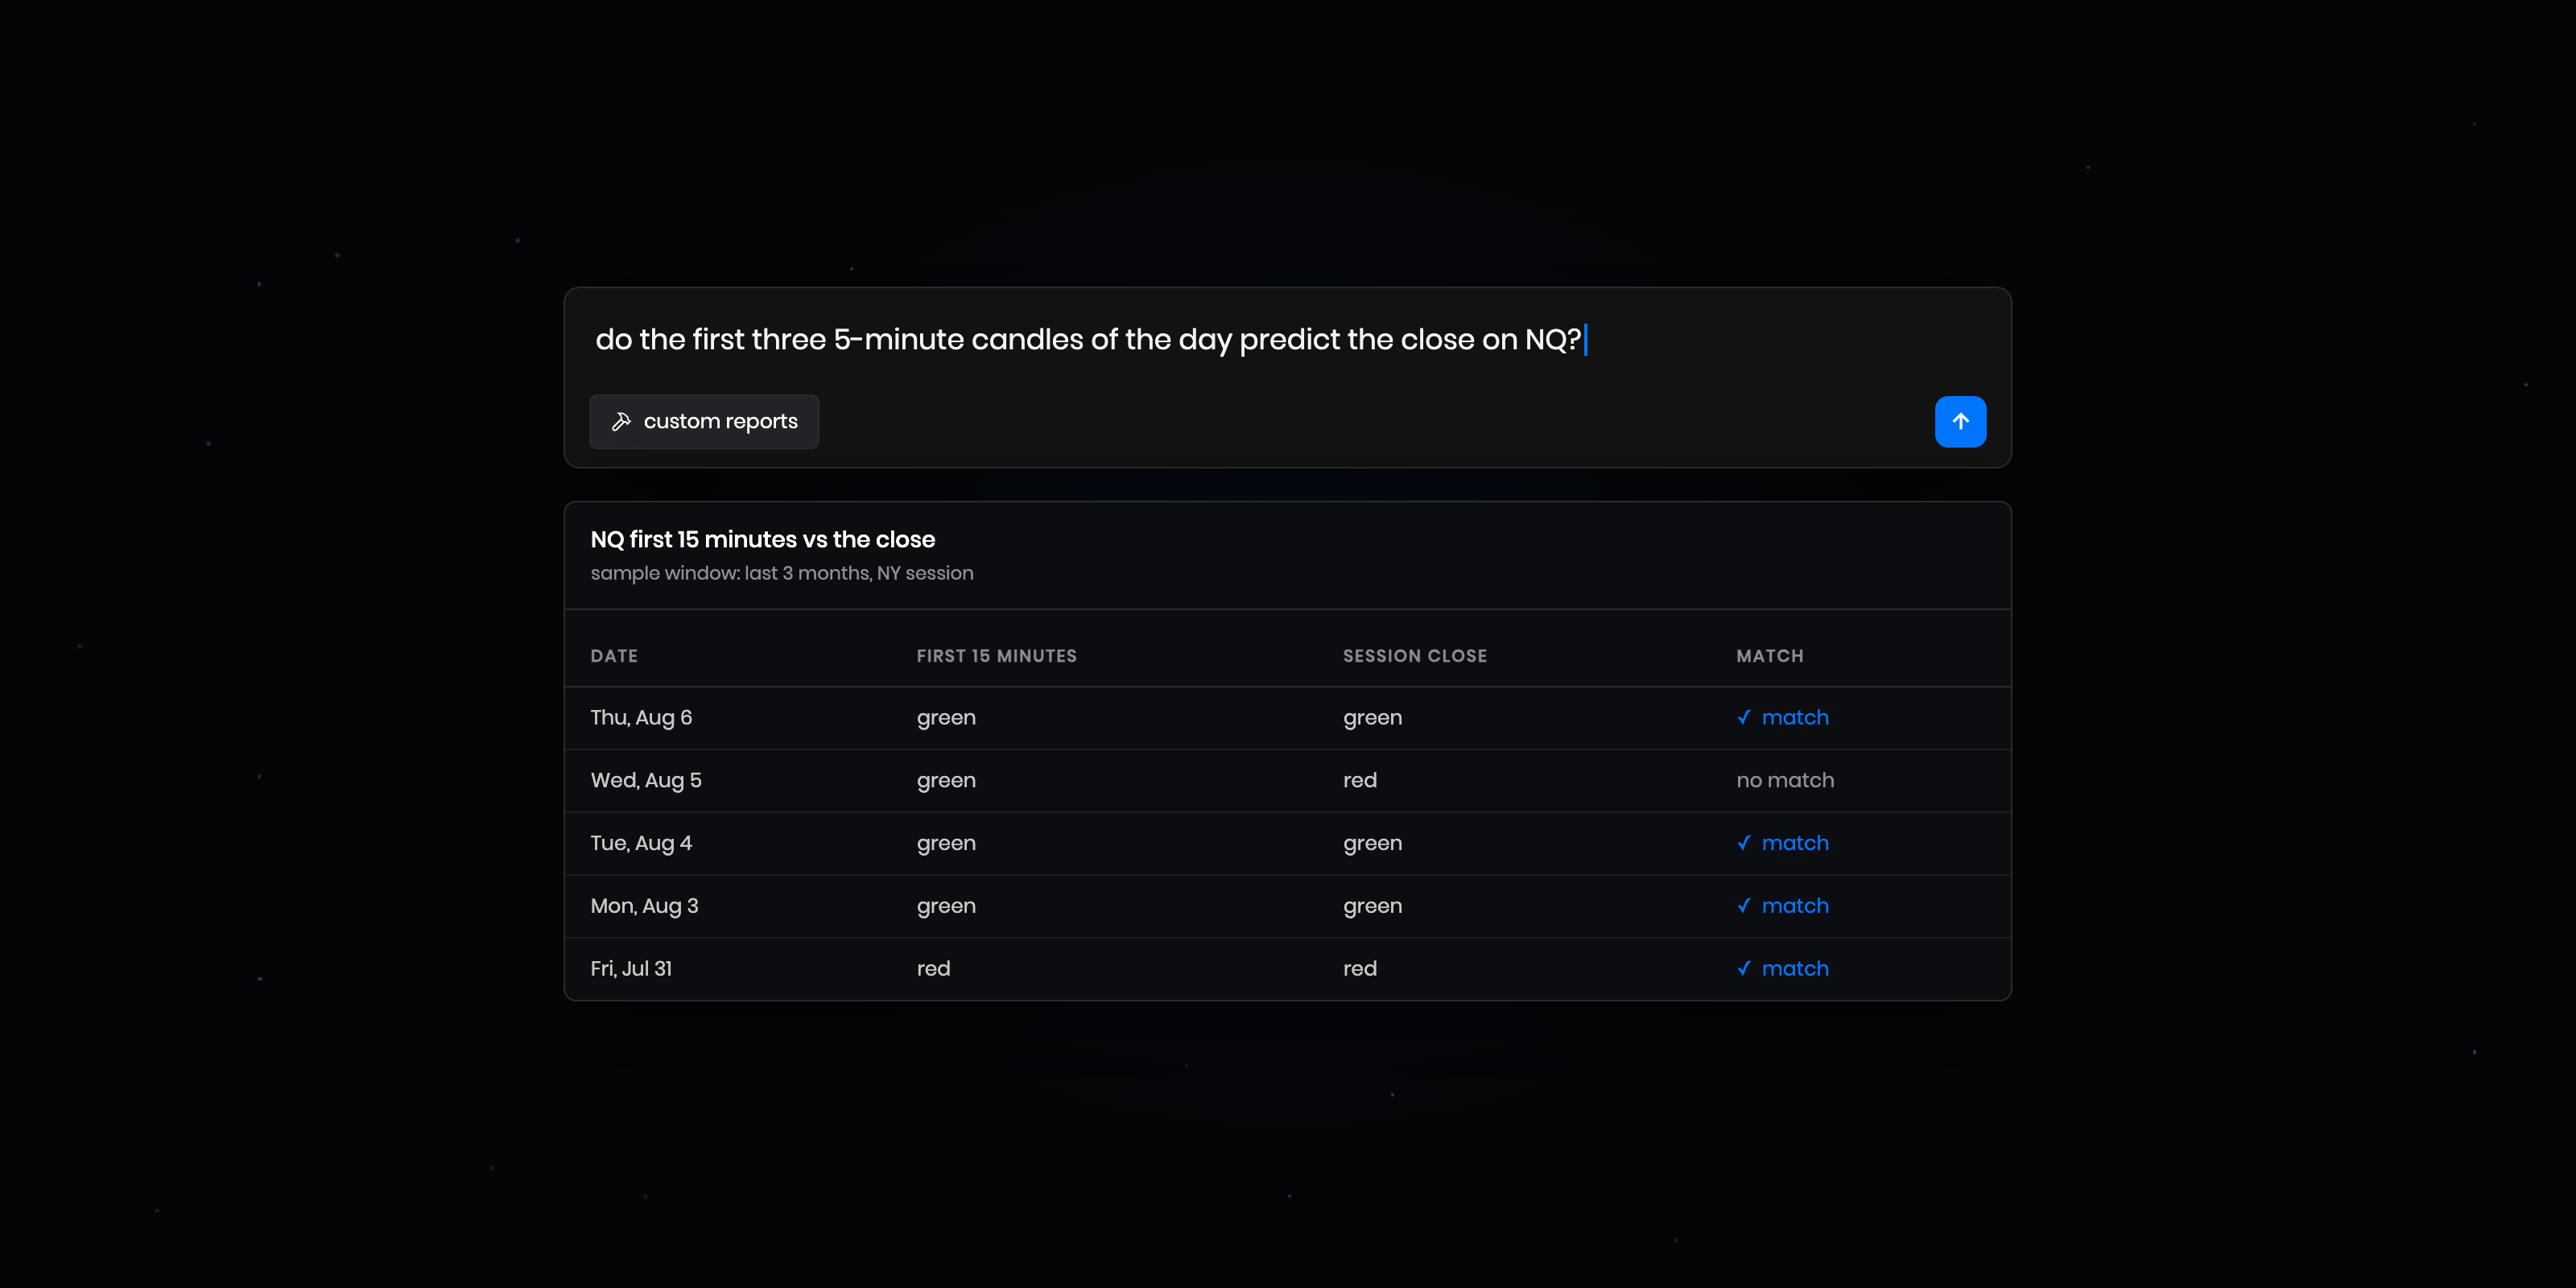
by 9:45AM ET, the first three 5-minute candles of the NY session are already on your chart. run the opening candle continuation report with one customization and you can measure whether those candles carry any information about the close. according to edgeful data, on NQ they do: over a recent 3-month window (May 7 through Aug 6, 2026, 66 NY sessions), the color of the first 15 minutes matched the color of the 4:00PM ET close in 43 of 66 sessions. nearly 2 out of 3.
that's the starting point. the more useful finding came from a follow-up question the report can't answer on its own: what happens when you check the same question again at noon? this article covers both. the base numbers, and a two-checkpoint process that pushed the agreement rate to about 87% over the last 6 months (as of Aug 2026) on NQ in the NY session.
table of contents:
- what the opening candle continuation report measures
- the data: NQ's first 15 minutes vs the close
- the follow-up question: what does noon tell you?
- the two-checkpoint process
- the honest limits
- how to apply the opening candle continuation report
- key takeaways: opening candle continuation at 15 minutes
what the opening candle continuation report measures
the opening candle continuation report tracks one thing: when the opening candle of the session is green or red, how often does the session close in that same direction?
by default, the opening candle is 60 minutes. we've broken down that version before in our opening candle continuation strategy guide. the customization that matters here is simple: change the opening candle length to 15 minutes, and the opening candle becomes your first three 5-minute candles.
that one change turns the opening candle continuation report into a very early checkpoint. instead of waiting until 10:30AM ET for a 60-minute candle to finish, you have your first data point at 9:45AM ET, 15 minutes into the session.
the data: NQ's first 15 minutes vs the close
here's what the opening candle continuation report shows on NQ over a recent 3-month window (May 7 through Aug 6, 2026) in the NY session, 66 sessions total:
- green opening 15 minutes: 35 sessions. the session closed green 62.86% of the time (22 of 35).
- red opening 15 minutes: 31 sessions. the session closed red 67.74% of the time (21 of 31).
- overall: the close matched the first 15 minutes in 43 of 66 sessions.
62.86% and 67.74% are real rates for a data point you have 15 minutes into the day. they're also nowhere near certainty, and a bias this early in the session needs confirmation before it's worth acting on. that's where the next two sections come in.
the follow-up question: what does noon tell you?
the report measures continuation into the 4:00PM ET close. but if you trade the morning, your day may be done by lunch. so the natural follow-up question: can the first 15 minutes help you determine a bias for the first half of the day, up until 12:00PM ET?
that specific customization isn't possible inside the opening candle continuation report, so I built the analysis separately. same ticker (NQ), same NY session, same 3-month window (May 7 through Aug 6, 2026), but measuring where price sits at 12PM ET instead of the 4PM close:
- green opening 15 minutes: still green at noon 62.86% of the time. the same rate as the 4PM close.
- red opening 15 minutes: still red at noon only 45.16% of the time (14 of 31). significantly different from the 4PM close.
so the honest answer is no, on red mornings especially. a red first 15 minutes on NQ tells you almost nothing about where price sits at noon. fewer than half of those sessions were still red at 12PM.
the two-checkpoint process
here's where the noon data becomes useful. the first 15 minutes are your first data point. where price sits at noon versus the 9:30AM ET open is your second. compare them.
at 12:00PM ET, look at where NQ trades versus the 9:30AM ET open and answer one question: does it agree with the first 15 minutes?
on the same 66 NQ sessions in the NY session (May 7 through Aug 6, 2026):
- green first 15 minutes AND still green at noon: 22 sessions. the close was green in 18 of them (81.8%).
- red first 15 minutes AND still red at noon: 14 sessions. the close was red in 13 of them (92.9%).
- when the two checkpoints disagree: you have no bias on the close. knowing when you have no edge matters just as much as knowing when you do.
and the pattern isn't unique to this window. over the last 6 months on NQ in the NY session, green 15 minutes plus a green noon checkpoint ended the day green 86.96% of the time (40 of 46), and red 15 minutes plus a red noon checkpoint ended the day red 86.67% of the time (26 of 30).
the data shows that when both checkpoints on NQ point the same way, the close has followed that direction about 87% of the time over the last 6 months in the NY session. when they disagree, the edge isn't there.
the honest limits
before you build anything around these numbers, a few things the data does NOT say:
- the 92.9% comes from 14 sessions. that's a small sample. samples that small move fast, and a different 3-month window can print a meaningfully different rate. the 6-month numbers (86.96% and 86.67%) rest on more sessions, which is why they're the better anchor.
- red mornings are noisy before noon. the 45.16% still-red rate at 12PM means a red first 15 minutes gives you no useful bias on the morning itself. the red-day edge only shows up when noon confirms.
- disagreement days are no-bias days. 30 of the 66 sessions in this window (about 45%) had checkpoints pointing in opposite directions. on those days, the data gives you no basis to call the close either way.
- this is a bias, not an entry. the report doesn't take the trade for you. no entry price, no stop, no target. it tells you which direction the data favors into the close, and you still need a setup you already trade to act on it.
- one ticker, one session. everything above is NQ in the NY session. ES behaves differently enough that it needs its own run before you assume anything transfers (our ES vs NQ comparison covers how differently the two indexes move).
how to apply the opening candle continuation report
the process takes seconds at each checkpoint:
- 9:45AM ET: note the color of the first three 5-minute candles on NQ. run the opening candle continuation report at the 15-minute setting to see the current continuation rates behind that color. if you want the opening range drawn on your chart automatically, the opening candle continuation TradingView indicator plots it for you.
- 12:00PM ET: check where NQ sits versus the 9:30AM ET open.
- both checkpoints agree: the close has matched that direction about 87% of the time over the last 6 months on NQ in the NY session. use that as directional context for how you manage afternoon trades, hold decisions, or whether you fade moves against the bias.
- checkpoints disagree: no bias into the close. treat the afternoon as neutral.
two more notes. the market open volume report works off the same first 15 minutes and adds a volume dimension to the 9:45AM ET checkpoint. and fold both timestamps into a simple day trading routine rather than trying to remember them mid-session.
and keep the numbers current. continuation rates drift as market conditions change, so re-run the opening candle continuation report monthly rather than trading November on May's data.
one more thing: the noon numbers in this article came from something new we've been working on. if you can describe a stat, report, or pattern you want to analyze, you'll be able to test it. that's all I'll say for now.
key takeaways: opening candle continuation at 15 minutes
- set the opening candle continuation report to 15 minutes and the opening candle becomes your first three 5-minute candles, giving you a data point at 9:45AM ET.
- on NQ over a recent 3-month window (May 7 through Aug 6, 2026, NY session), the close matched the first 15 minutes in 43 of 66 sessions: green continued 62.86% of the time (22 of 35), red continued 67.74% (21 of 31).
- the first 15 minutes say almost nothing about noon on red days: only 45.16% of red mornings (14 of 31) were still red at 12PM ET.
- the two-checkpoint process fixes that: when the first 15 minutes and the noon position versus the 9:30AM ET open agree on NQ, the close matched 81.8% (18 of 22) on green days and 92.9% (13 of 14) on red days over the 3-month window.
- the 6-month rates on NQ in the NY session are steadier: 86.96% (40 of 46) green and 86.67% (26 of 30) red when both checkpoints agree.
- when the checkpoints disagree, you have no bias on the close.
- treat this as directional context: pair the bias with a setup you already trade, and re-run the numbers monthly.
trading involves substantial risk of loss. historical data does not guarantee future results. always do your own research before making trading decisions.