build a no-code trading dashboard with the edgeful API
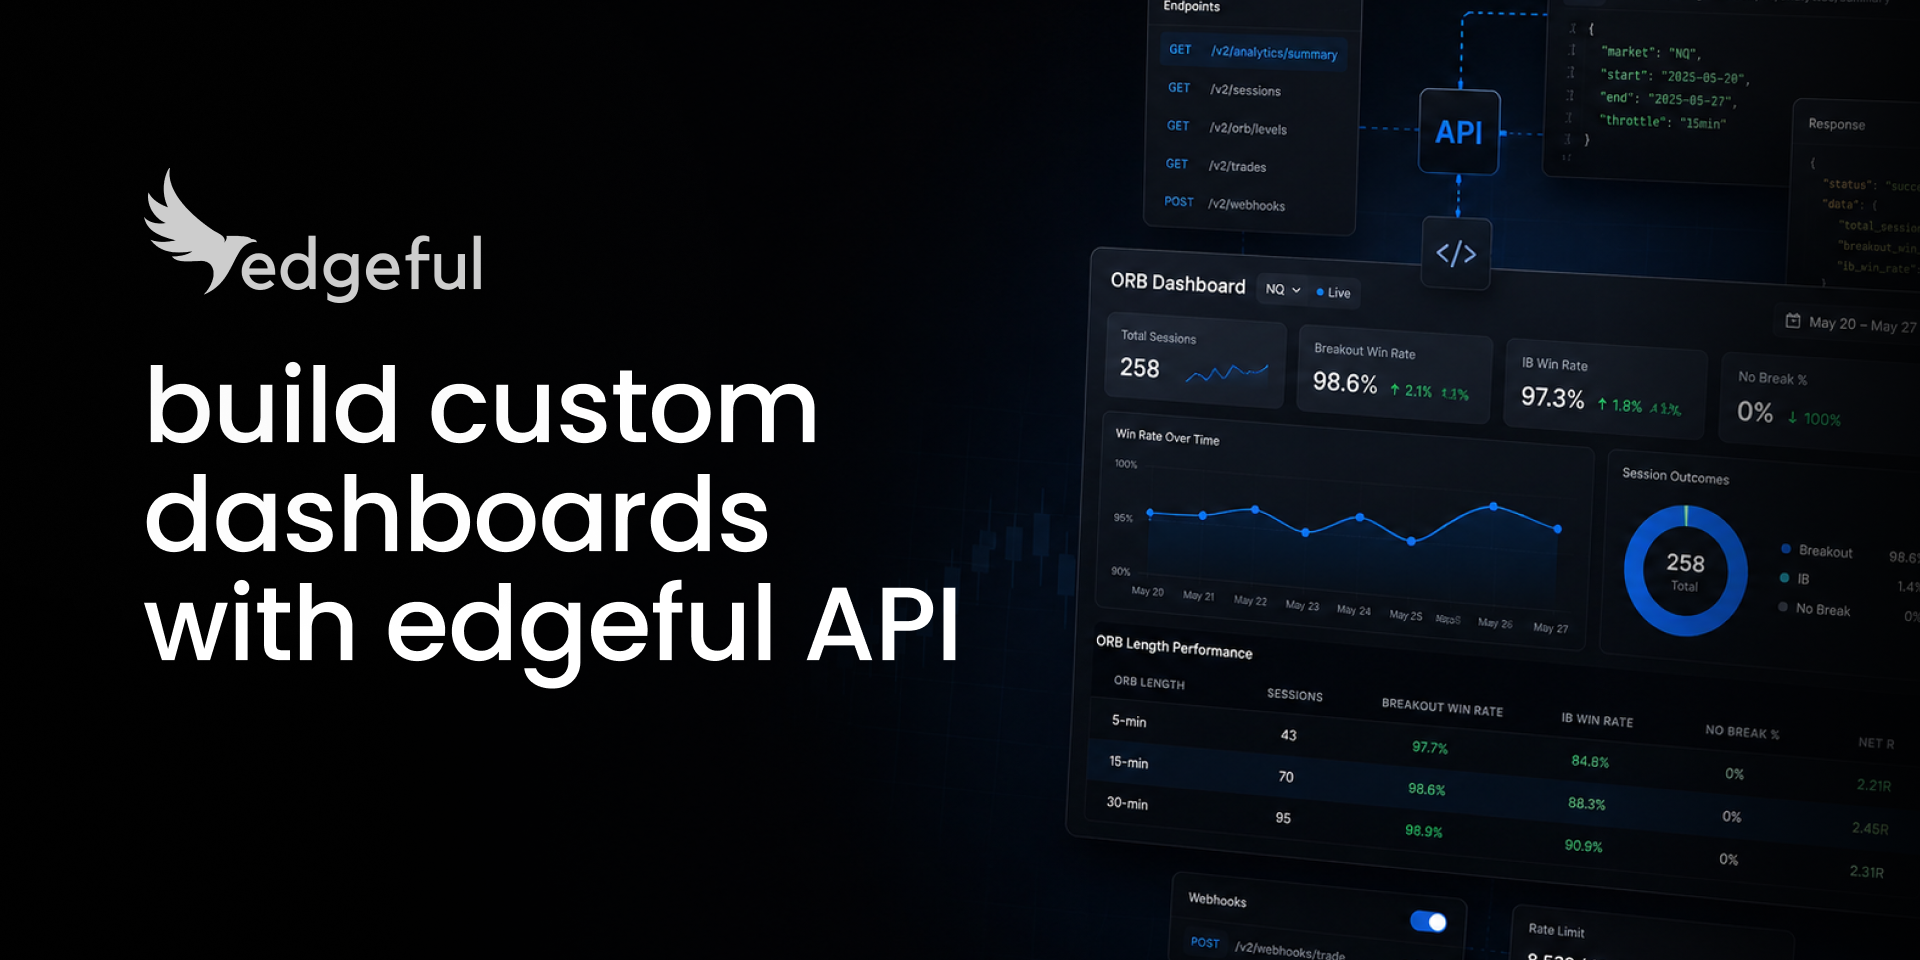
most traders who hear "API" assume they need VS Code, a python install, and a free weekend to figure it out. so they don't bother. that's the gap between a working no code trading dashboard and not having one, and it's almost always the wrong assumption. a no code trading dashboard is closer to a conversation than a coding project.
the actual setup is shorter than the time it takes to scroll back through your trade journal. an AI agent, edgeful API endpoints, and three minutes from question to first response.
since the edgeful API went live about 10 days ago, traders have been creating new dashboards that I couldn’t not share.
one of them, the one I built yesterday, flags a setup that closes the session red 88.0% of the time on ES and 90.3% of the time on NQ over the last 6 months.
this post walks through all five. the goal is two things:
- show you what a no code trading dashboard actually looks like when it's running,
- and prove the setup is short enough that it's worth doing today.
table of contents
- what counts as a no-code trading dashboard
- the no-code trading dashboard I built: red OC + rejected IB high
- TXtrades' A+ live confluence scanner
- TXtrades' pre-market futures analyzer
- mario's QQQ + SPY daily bias scanner
- frank's pre-NFP IB rejection research
- the 3-minute setup that gets you the first response
- key takeaways
what counts as a no-code trading dashboard
a trading dashboard isn't a chart layout. and a no code trading dashboard isn't a worse version of one that's built in python. it's a custom trading dashboard sized to the tickers you trade, the reports you care about, and the rules you've decided are worth running every morning.
the data comes from the edgeful API. the formatting and the logic come from whatever AI agent you point at it. the output lands wherever you actually read things: Discord, Slack, email inbox, a Notion page, a private webpage you host yourself. building a trading dashboard without coding used to mean settling for a prebuilt tool that didn't fit your rules. with an API + an AI agent, it doesn't anymore.
what makes a no code trading dashboard "no-code" isn't that there's no code involved anywhere. claude or your LLM of choice is writing the code behind the scenes. you describe the dashboard in plain English, the agent writes the script, you run it. that's the practical definition of a trading dashboard with claude or any other agent: a conversation that produces a working scanner. if you're brand new to the API, the edgeful API quickstart covers the setup and the first call before you tackle a full build.
the no-code trading dashboard I built: red OC + rejected IB high
the question I wanted answered was simple. when the first-hour candle closes red AND the IB high gets rejected (high formed first, low broke first), how often does the full session close red?
two early bearish signals on the same day. by 10:30 ET both have triggered. the no code trading dashboard checks how that confluence has played out historically across ES and NQ in the NY session. it's a small AI trading dashboard built for exactly one question.
on ES, the session closed red 88.0% of the time. 22 of 25 confluence days over the window from 12/04/25 to 06/04/26. the baseline red-day rate for ES over the same window is 46.1%. the confluence lifts the close-direction probability +41.9 points above base.
on NQ, the session closed red 90.3%. 28 of 31 confluence days. baseline 44.5%, lift +45.8 points.
what that means at the desk: by 10:30 ET on these days, the bias for the rest of the session is already pretty clear. you don't need the next 5 hours of price action to tell you what's likely. the close tends to follow.
the confluence isn't an independent signal, it's a confirmation that the early sellers have follow-through. the opening candle continuation strategy covers the underlying logic of why the first 60 minutes of the NY session matter so much for the rest of the day.
TXtrades' A+ live confluence scanner
TXtrades had been building his own pre-market analysis tool for months before the API went live. once it went live, he layered every edgeful confluence stat into his existing screener. the result is a custom trading dashboard that gets ES, NQ, and YM in three live columns, with every setup tagged by probability, sample size, and an IN PLAY / WAITING status.
"forgot my A+ setup scanner! right now this against the pre-market WIP + my own volume based strategy. layering live WIP over the weekend." his words from Discord.
the pattern matters more than the specific build. TXtrades had the screener architecture already. what he didn't have, and what nobody had before 10 days ago, was a data layer that could feed it live edgeful probabilities. the API filled that gap. the dashboard turned from a layout into a tool with edges baked in.
TXtrades' pre-market futures analyzer
same builder, different tool. this one runs before the open. it scans NQ, ES, and YM across edgeful's reports and assigns a "best to focus on" score by 9:20 ET. he calls it Futures Pilot.
months of work on the analyzer side. once the edgeful API got plugged in, the data layer was done. that's worth pausing on. building a trading dashboard with claude doesn't require an "integration" in the traditional sense.
the "integration" he had to do was paste a few endpoint URLs into the prompt. the rest is claude writing the code against edgeful's published docs and rendering the output where his existing screener already lived. this is the second TXtrades example of an AI trading dashboard turning an existing screener architecture into something with edgeful's data running through it.
mario's QQQ + SPY daily bias scanner
mario followed the prompts we sent out last week. each card shows a multi-report confluence: gap down, ORB breakdown, and a previous day's low break, all in one view. probability, sample size, IN PLAY / WAITING / NOT TODAY badges per card.
"played with the API's this weekend following the example. made a screener for the top strategies on QQQ/SPY, then added ability to check the strategy during the trading day to see if it's in play. turns out the ORB and PDH break played out today." his words.
the structural pattern is the same as the what's in play screener we built in-house, except mario sized his to his tickers and his rules. that's the part of a custom trading dashboard that you can't get from any prebuilt tool. the rules and the tickers are yours. it's another argument for trading dashboard without coding: the prebuilt version optimizes for the average user, your version optimizes for you.
frank's pre-NFP IB rejection research
frank used the API differently. instead of a live scanner, he built a research dashboard to answer one specific question: on the Thursday before NFP, does IB rejection still hold as an edge, or does the pre-NFP filter actually mean something?
the answer he got was 64% over 11 sessions. essentially the same as the all-Thursday baseline for the same instrument. so the "pre-NFP" condition wasn't adding anything. the filter was noise, not signal.
that's the use case people forget. a no code trading dashboard isn't just for live scanners. it's for testing your assumptions before you put money behind them. frank's setup is one of the cleaner edgeful API examples of using a trading dashboard with claude as a research tool, not a live scanner. if you've ever held a belief like "this report works better on day X" or "skip the trade if Y is happening," that's exactly the kind of question the API can answer in one prompt. for ES/NQ-specific behavior worth testing the same way, the ES vs NQ comparison covers the differences that show up between the two contracts.
the 3-minute setup for a no code trading dashboard
this is the part every builder above has told me the same thing about: the setup for a no code trading dashboard was way easier than they thought it'd be.
here's what it actually is:
- grab your API key from your edgeful settings page
- paste it into claude (or any agent that can hit a REST endpoint)
- ask a question
that's it. no VS Code. no python install. no 10-hour youtube tutorial about REST APIs. about 3 minutes to get the first response back, and from there everything is conversation. trading dashboard without coding is the default state, not an exception.
the gap between members who've built something and members who haven't isn't technical ability. it's the 3 minutes of setup. the five dashboards above were each built in one or two sittings by people who started from the exact same place. if you're comparing edgeful's API against raw market data providers before you decide, the polygon vs databento vs edgeful futures data api comparison walks through what you're actually paying for: pre-computed probability statistics, not raw OHLCV bars. the dashboard reads finished math, not feeds you have to recompute. that's the whole point of a trading dashboard with claude over a from-scratch python build: the math is done before the agent ever sees the response.
get access to edgeful API here.
key takeaways
- a no code trading dashboard is a custom trading dashboard built by asking an AI agent to query the edgeful API. you describe what you want in plain English, the agent writes the script. trading dashboard without coding is the default
- five working edgeful API examples have been built in the last 10 days. one from André, four from members. none of the builders wrote a line of code
- the red OC + rejected IB high confluence closes the session red 88.0% on ES (22 of 25 sessions) and 90.3% on NQ (28 of 31 sessions) over the last 6 months in the NY session
- a no code trading dashboard isn't only for live scanners. frank used a trading dashboard with claude to research whether a filter ("pre-NFP thursdays") was adding anything. it wasn't. that's a no code trading dashboard as a research tool
- the setup for an AI trading dashboard takes 3 minutes: API key from your edgeful settings page, paste into claude, ask a question
- results from any no code trading dashboard still require customization, time, and effort. the API removes the data step. the trading judgment is still on you
historical data does not guarantee future returns. the probability numbers in this guide are based on a specific 6-month window (12/04/25 to 06/04/26) of NY session data across ES and NQ and should be re-verified against current windows before use. statistical edges decay over time, market environment shifts, and live trading still requires risk management beyond pulling data into a dashboard.