
volume trends report: what it measures and how traders use it
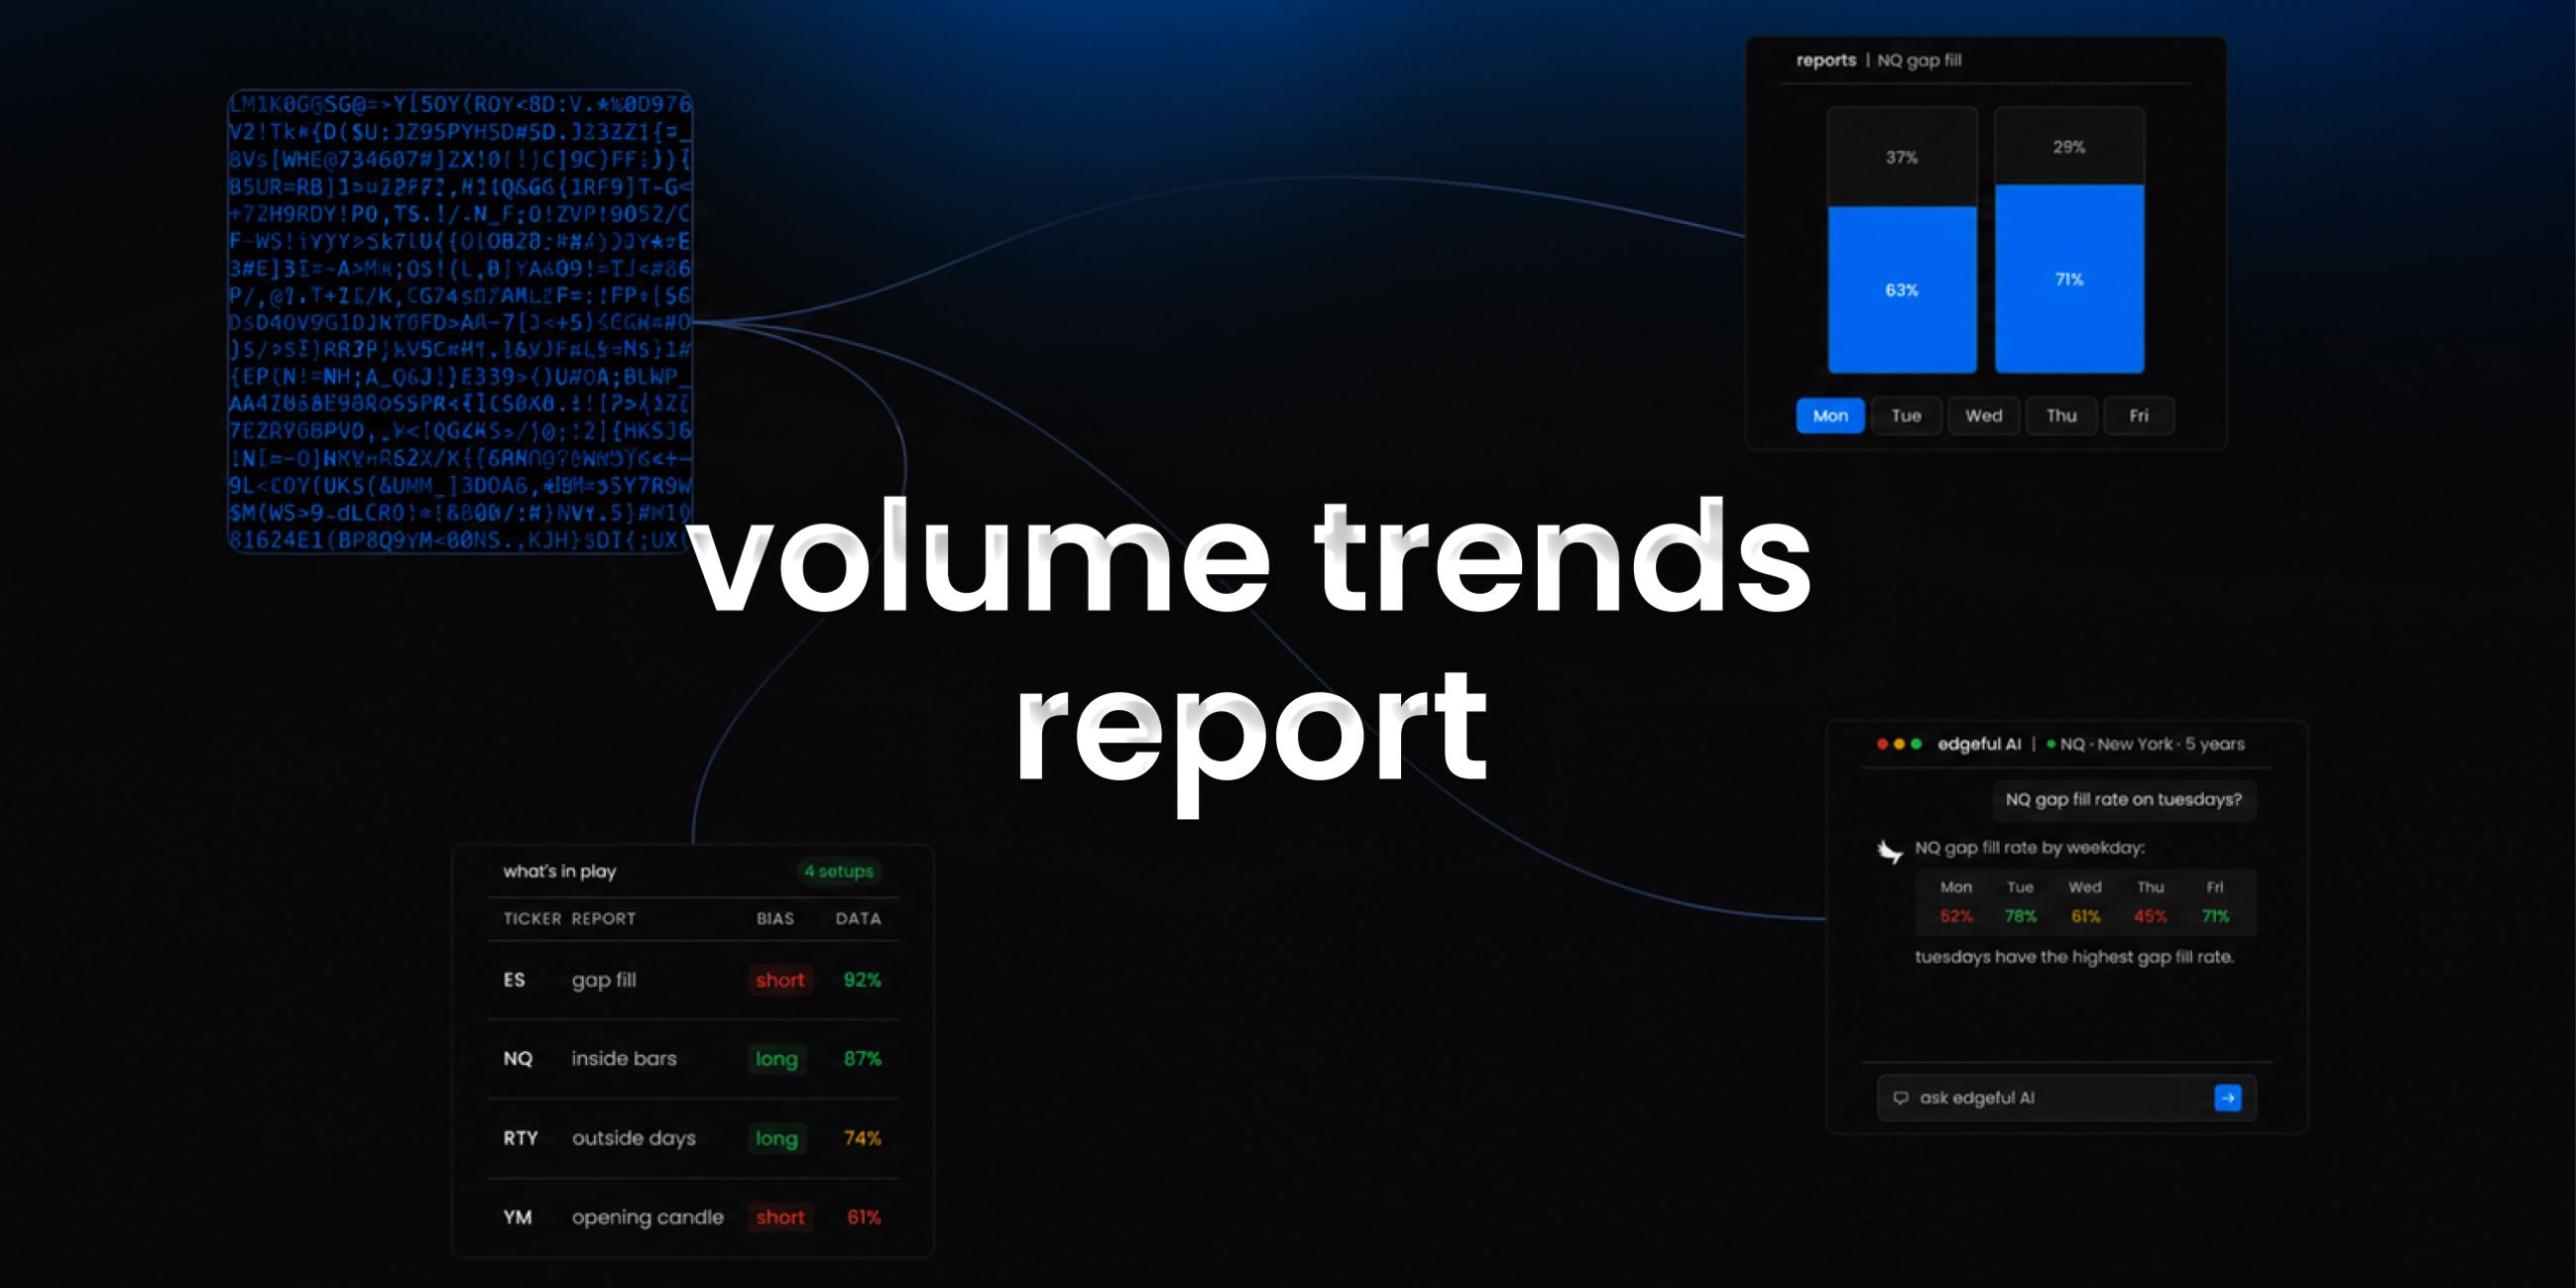
the volume trends report on edgeful analyzes historical trading volume aggregated by month and by week to surface seasonal patterns in market activity.
calculates average monthly volume across calendar months and average weekly volume across ISO weeks so you can see when activity historically picks up or fades.
this is one of the 150+ reports available on the edgeful platform. here's how it works, what the data shows, and how traders use it.
table of contents
- what the volume trends report measures
- how the calculation works
- how traders use volume trends data
- combining volume trends with other reports
- key takeaways
what the volume trends report measures
resamples historical volume to monthly totals and weekly totals, then averages each across the lookback. produces a year-over-year volume profile so you can see which months and weeks have historically run heavy and which run light.
the report is available for futures, stocks, ETFs, forex, and crypto. you can filter by ticker, view (monthly or weekly), and lookback period.
how the calculation works
the volume trends report rolls historical volume up to monthly and weekly buckets.
- the report converts the date column to a datetime index and resamples volume to monthly totals
- the current (incomplete) month is excluded so the average isn't distorted
- monthly totals are grouped by calendar month and averaged across the lookback
- the same process runs weekly using ISO week numbers
- detailed breakdowns show each year's contribution to the monthly average
- the output is a monthly summary, a weekly summary, and a year-by-year detail set
how traders use volume trends data
- setting expectations for low-volume months (summer, December) where chop and false breakouts are more common
- pulling profit targets in during historically quiet months and pushing them out during active ones
- knowing when institutional participation tends to drop so you can size down accordingly
- pairing with seasonality to overlay performance and participation patterns
- planning vacation, paper-trade, or scale-back windows around historically slow weeks
the data doesn't tell you to trade. the volume trends report tells you the historical performance of the setup in front of you. what you do with that information is your decision.
results require customization, time, and effort. the numbers change depending on your ticker, session, and lookback period. always check the data for your specific conditions.
combining volume trends with other reports
the volume trends report works best when combined with other edgeful reports for confluence:
- use the what's in play dashboard to see volume trends data alongside your other favorite reports in one view
- the screener lets you scan up to 49 tickers for volume trends setups across 4 reports simultaneously
- edgeful AI can analyze volume trends data alongside other reports and find patterns you'd never spot manually
key takeaways
- the edgeful volume trends report measures average monthly and weekly trading volume to surface seasonal participation patterns
- available for futures, stocks, ETFs, forex, and crypto with full ticker and date range filtering
- monthly and weekly views with year-over-year detail
- part of the 150+ reports included in the edgeful essential plan ($49/month or $39/month annual)
- works best when combined with other reports using what's in play, the screener, or edgeful AI
trading involves risk. past performance and historical data do not guarantee future results. the statistics referenced in this post are based on historical data and may not reflect future market conditions. always trade with proper risk management.
