
session reversal range report: what it measures and how traders use it
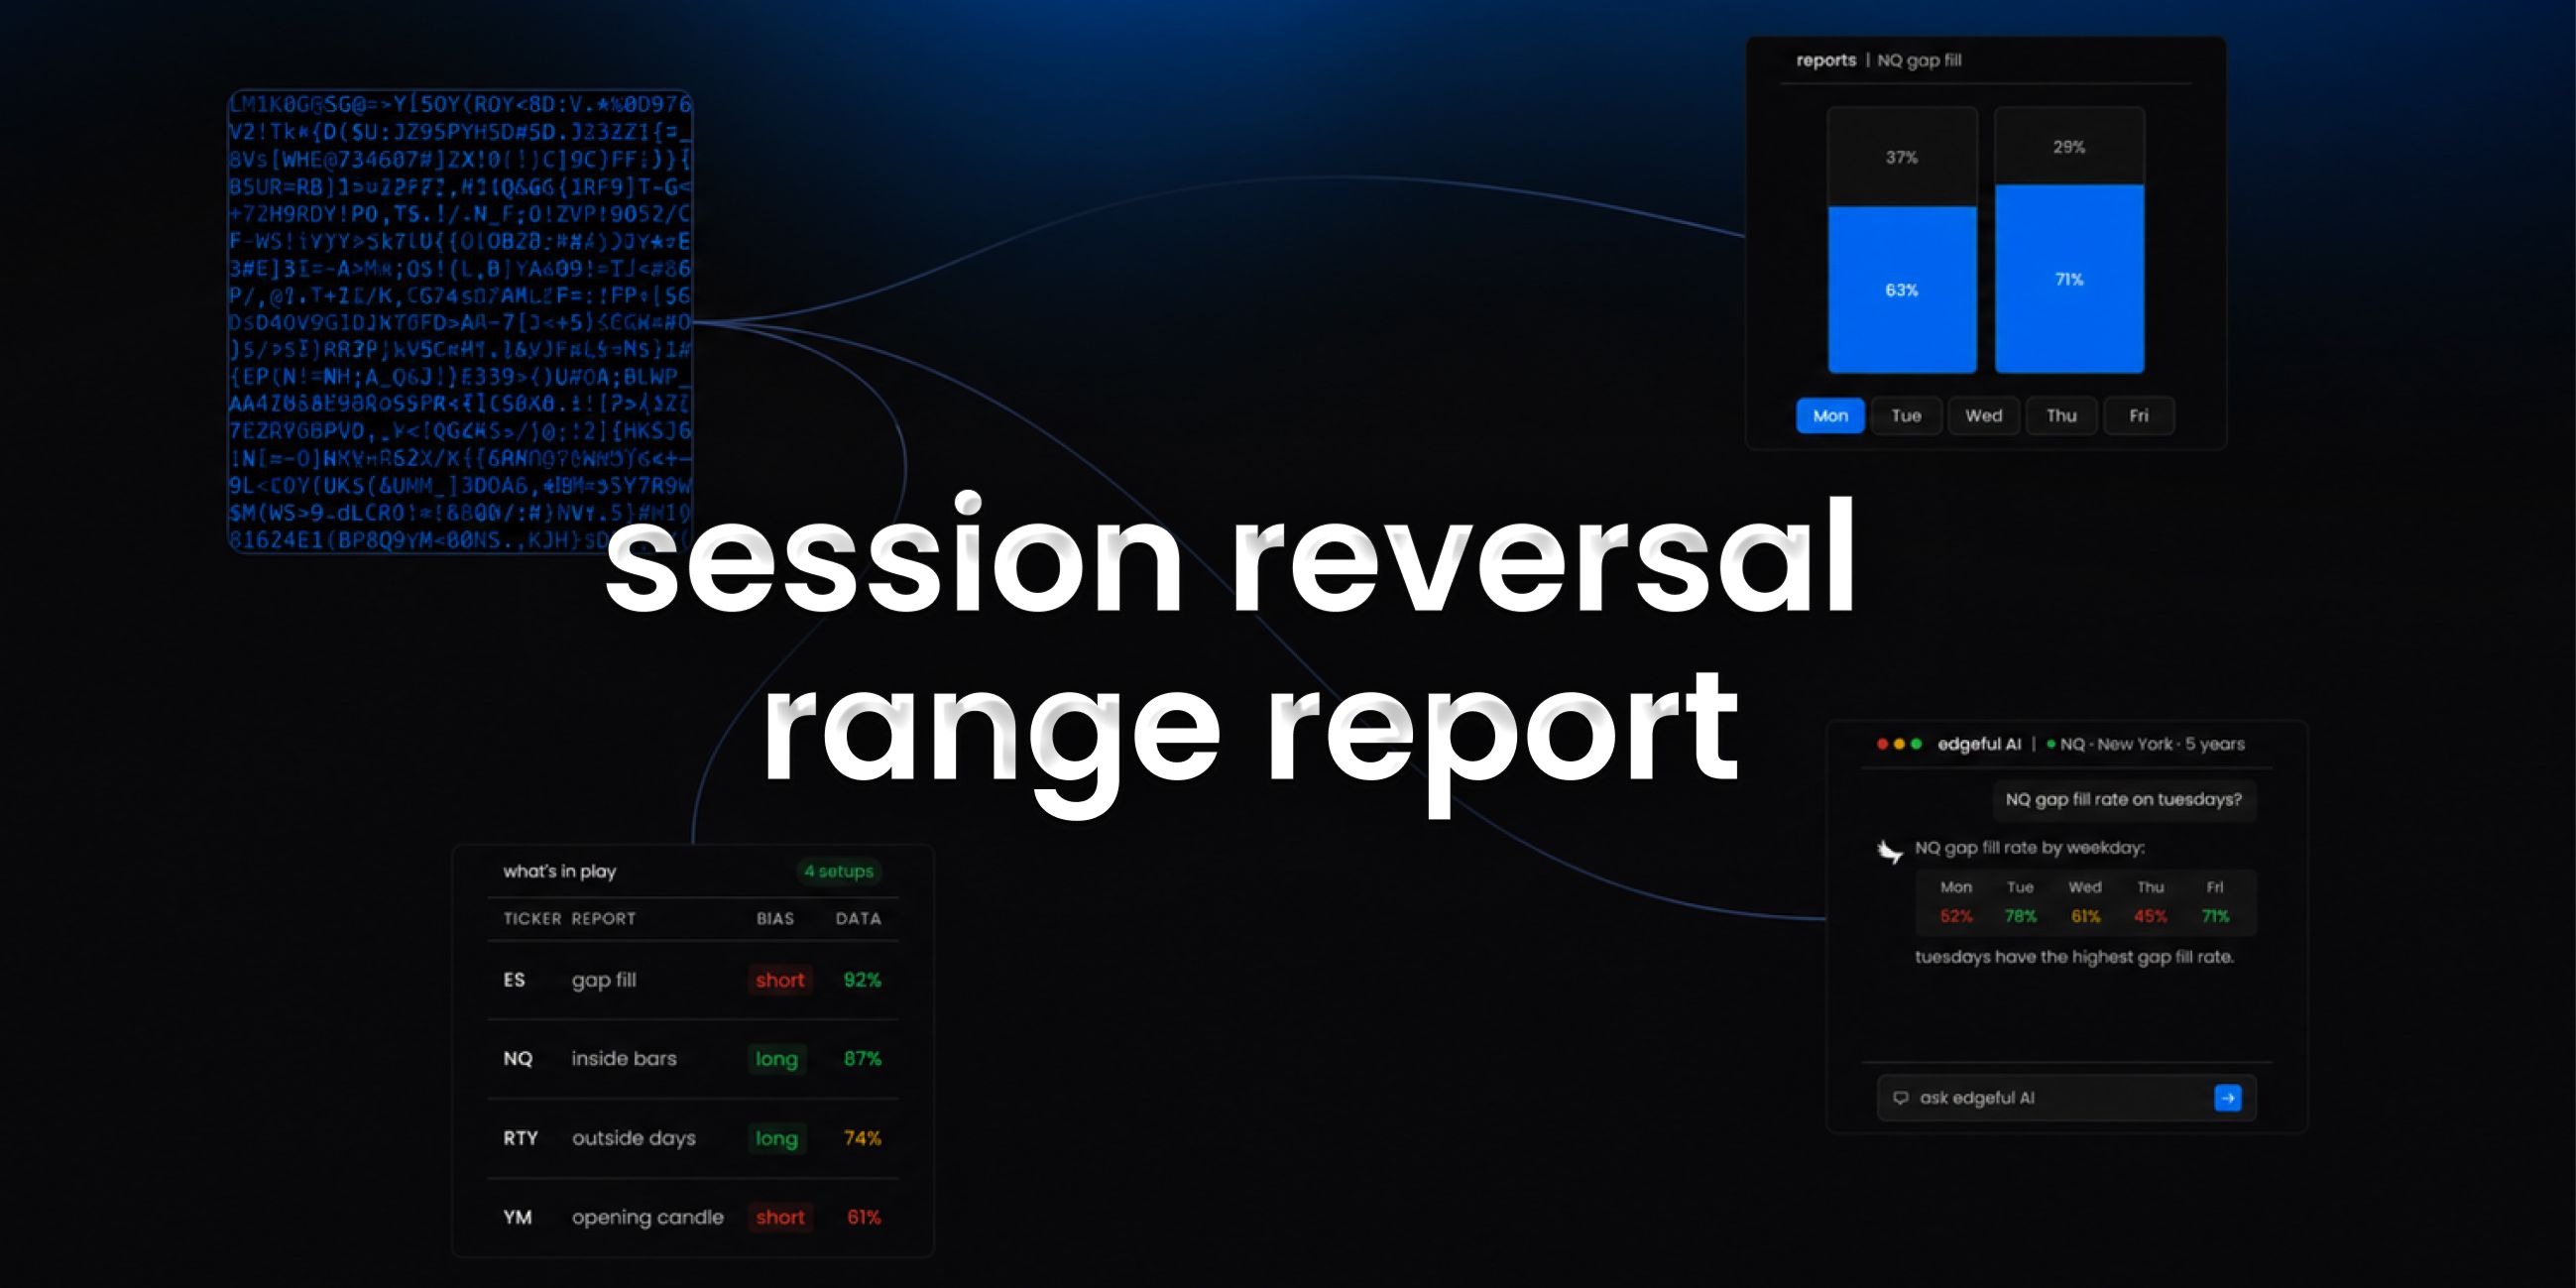
the session reversal range report on edgeful measures how much heat a session takes before closing in its direction — distance from open to low for green sessions, distance from open to high for red sessions.
surfaces the typical and maximum adverse excursion across green and red sessions so you can size stops with data behind them.
this is one of the 150+ reports available on the edgeful platform. here's how it works, what the data shows, and how traders use it.
table of contents
- what the session reversal range report measures
- how the calculation works
- available subreports
- how traders use session reversal range data
- combining session reversal range with other reports
- key takeaways
what the session reversal range report measures
scans every session in the lookback. green sessions (close at or above open) get measured by absolute distance from open down to the session low. red sessions (close below open) get measured by absolute distance from open up to the session high. reports both absolute price ranges and percentage ranges, with average and maximum statistics for each session type.
the report is available for futures, stocks, ETFs, forex, and crypto. you can filter by ticker, session (NY, London, Asian, full globex, or custom), and lookback period.
how the calculation works
the session reversal range report tags each session as green or red and measures the reversal distance.
- the report classifies each session as green or red based on whether close ≥ open
- for green sessions it calculates absolute distance from open to low
- for red sessions it calculates absolute distance from open to high
- it computes percentage versions (reversal range / open × 100) for both
- averages and maximums are calculated for each session type
- the output shows typical heat and worst-case heat for both green and red sessions
available subreports
the session reversal range report has 1 subreport for deeper analysis:
by weekday. groups the same reversal range stats by weekday. surfaces which days take more heat before resolving and which weekdays tend to move cleanly without major adverse excursions.
how traders use session reversal range data
- setting stops with data-backed distance instead of guessing or using fixed dollar amounts
- understanding the typical "heat" a winning trade has to absorb before resolving
- choosing entry timing around average reversal range — entering closer to the historical reversal extreme improves R:R
- pairing with intraday timing to align entries with the typical reversal window
- knowing the maximum reversal so you can avoid moving stops to breakeven too early on choppy days
the data doesn't tell you to trade. the session reversal range report tells you the historical performance of the setup in front of you. what you do with that information is your decision.
results require customization, time, and effort. the numbers change depending on your ticker, session, and lookback period. always check the data for your specific conditions.
combining session reversal range with other reports
the session reversal range report works best when combined with other edgeful reports for confluence:
- use the what's in play dashboard to see session reversal range data alongside your other favorite reports in one view
- the screener lets you scan up to 49 tickers for session reversal range setups across 4 reports simultaneously
- edgeful AI can analyze session reversal range data alongside other reports and find patterns you'd never spot manually
key takeaways
- the edgeful session reversal range report measures how far green sessions drop from open to low and how far red sessions rise from open to high before closing
- available for futures, stocks, ETFs, forex, and crypto with full session, ticker, and date range filtering
- 1 subreport available: by weekday
- part of the 150+ reports included in the edgeful essential plan ($49/month or $39/month annual)
- works best when combined with other reports using what's in play, the screener, or edgeful AI
trading involves risk. past performance and historical data do not guarantee future results. the statistics referenced in this post are based on historical data and may not reflect future market conditions. always trade with proper risk management.
