overnight continuation report: what it measures and how traders use it
the overnight continuation report on edgeful analyzes the continuation patterns of overnight gaps by comparing current day open price to previous day close price to classify gaps as green or red overnight moves, then tracks whether the trading day continues in the same direction. Calculates frequency and percentage statistics for six categories of overnight-to-day combinations including green overnight green day and red overnight red day patterns.
this is one of the 150+ reports available on the edgeful platform. here's how it works, what the data shows, and how traders use it.
table of contents
- what the overnight continuation report measures
- how the calculation works
- available subreports
- how traders use overnight continuation data
- combining overnight continuation with other reports
- key takeaways
what the overnight continuation report measures
Analyzes the continuation patterns of overnight gaps by comparing current day open price to previous day close price to classify gaps as green or red overnight moves, then tracks whether the trading day continues in the same direction. Calculates frequency and percentage statistics for six categories of overnight-to-day combinations including green overnight green day and red overnight red day patterns.
the report is available for futures, stocks, ETFs, forex, and crypto. you can filter by ticker, session (NY, London, Asian, full globex, or custom), and lookback period (1 month to 5+ years).
how the calculation works
according to edgeful data, the overnight continuation report follows a specific calculation process:
the overnight continuation report analyzes whether the direction of the overnight gap predicts the rest of the trading day.
- the report compares each day's open to the previous day's close to classify the overnight move as green (gap up) or red (gap down)
- it then checks whether the trading day closes in the same direction as the overnight gap
- six outcome categories are tracked: green overnight into green day, green overnight into red day, red overnight into green day, red overnight into red day, and flat scenarios
- percentages show how often overnight direction predicts daily direction
available subreports
the overnight continuation report has 1 subreport for deeper analysis:
by weekday. analyzes overnight price gaps and their continuation patterns throughout the trading day, categorized by weekday.
how traders use overnight continuation data
- identifying overnight gap fade or continuation probabilities based on historical patterns
- setting intraday trading bias after overnight gaps using statistical continuation rates
- risk management for gap trading strategies using frequency data of overnight-to-day patterns
- optimizing entry timing for mean reversion or momentum strategies after overnight moves
- backtesting gap trading systems using detailed daily classification data
the data doesn't tell you to trade. the overnight continuation report tells you the historical performance of the setup in front of you. what you do with that information is your decision.
results require customization, time, and effort. the numbers change depending on your ticker, session, and lookback period. always check the data for your specific conditions.
combining overnight continuation with other reports
the overnight continuation report works best when combined with other edgeful reports for confluence:
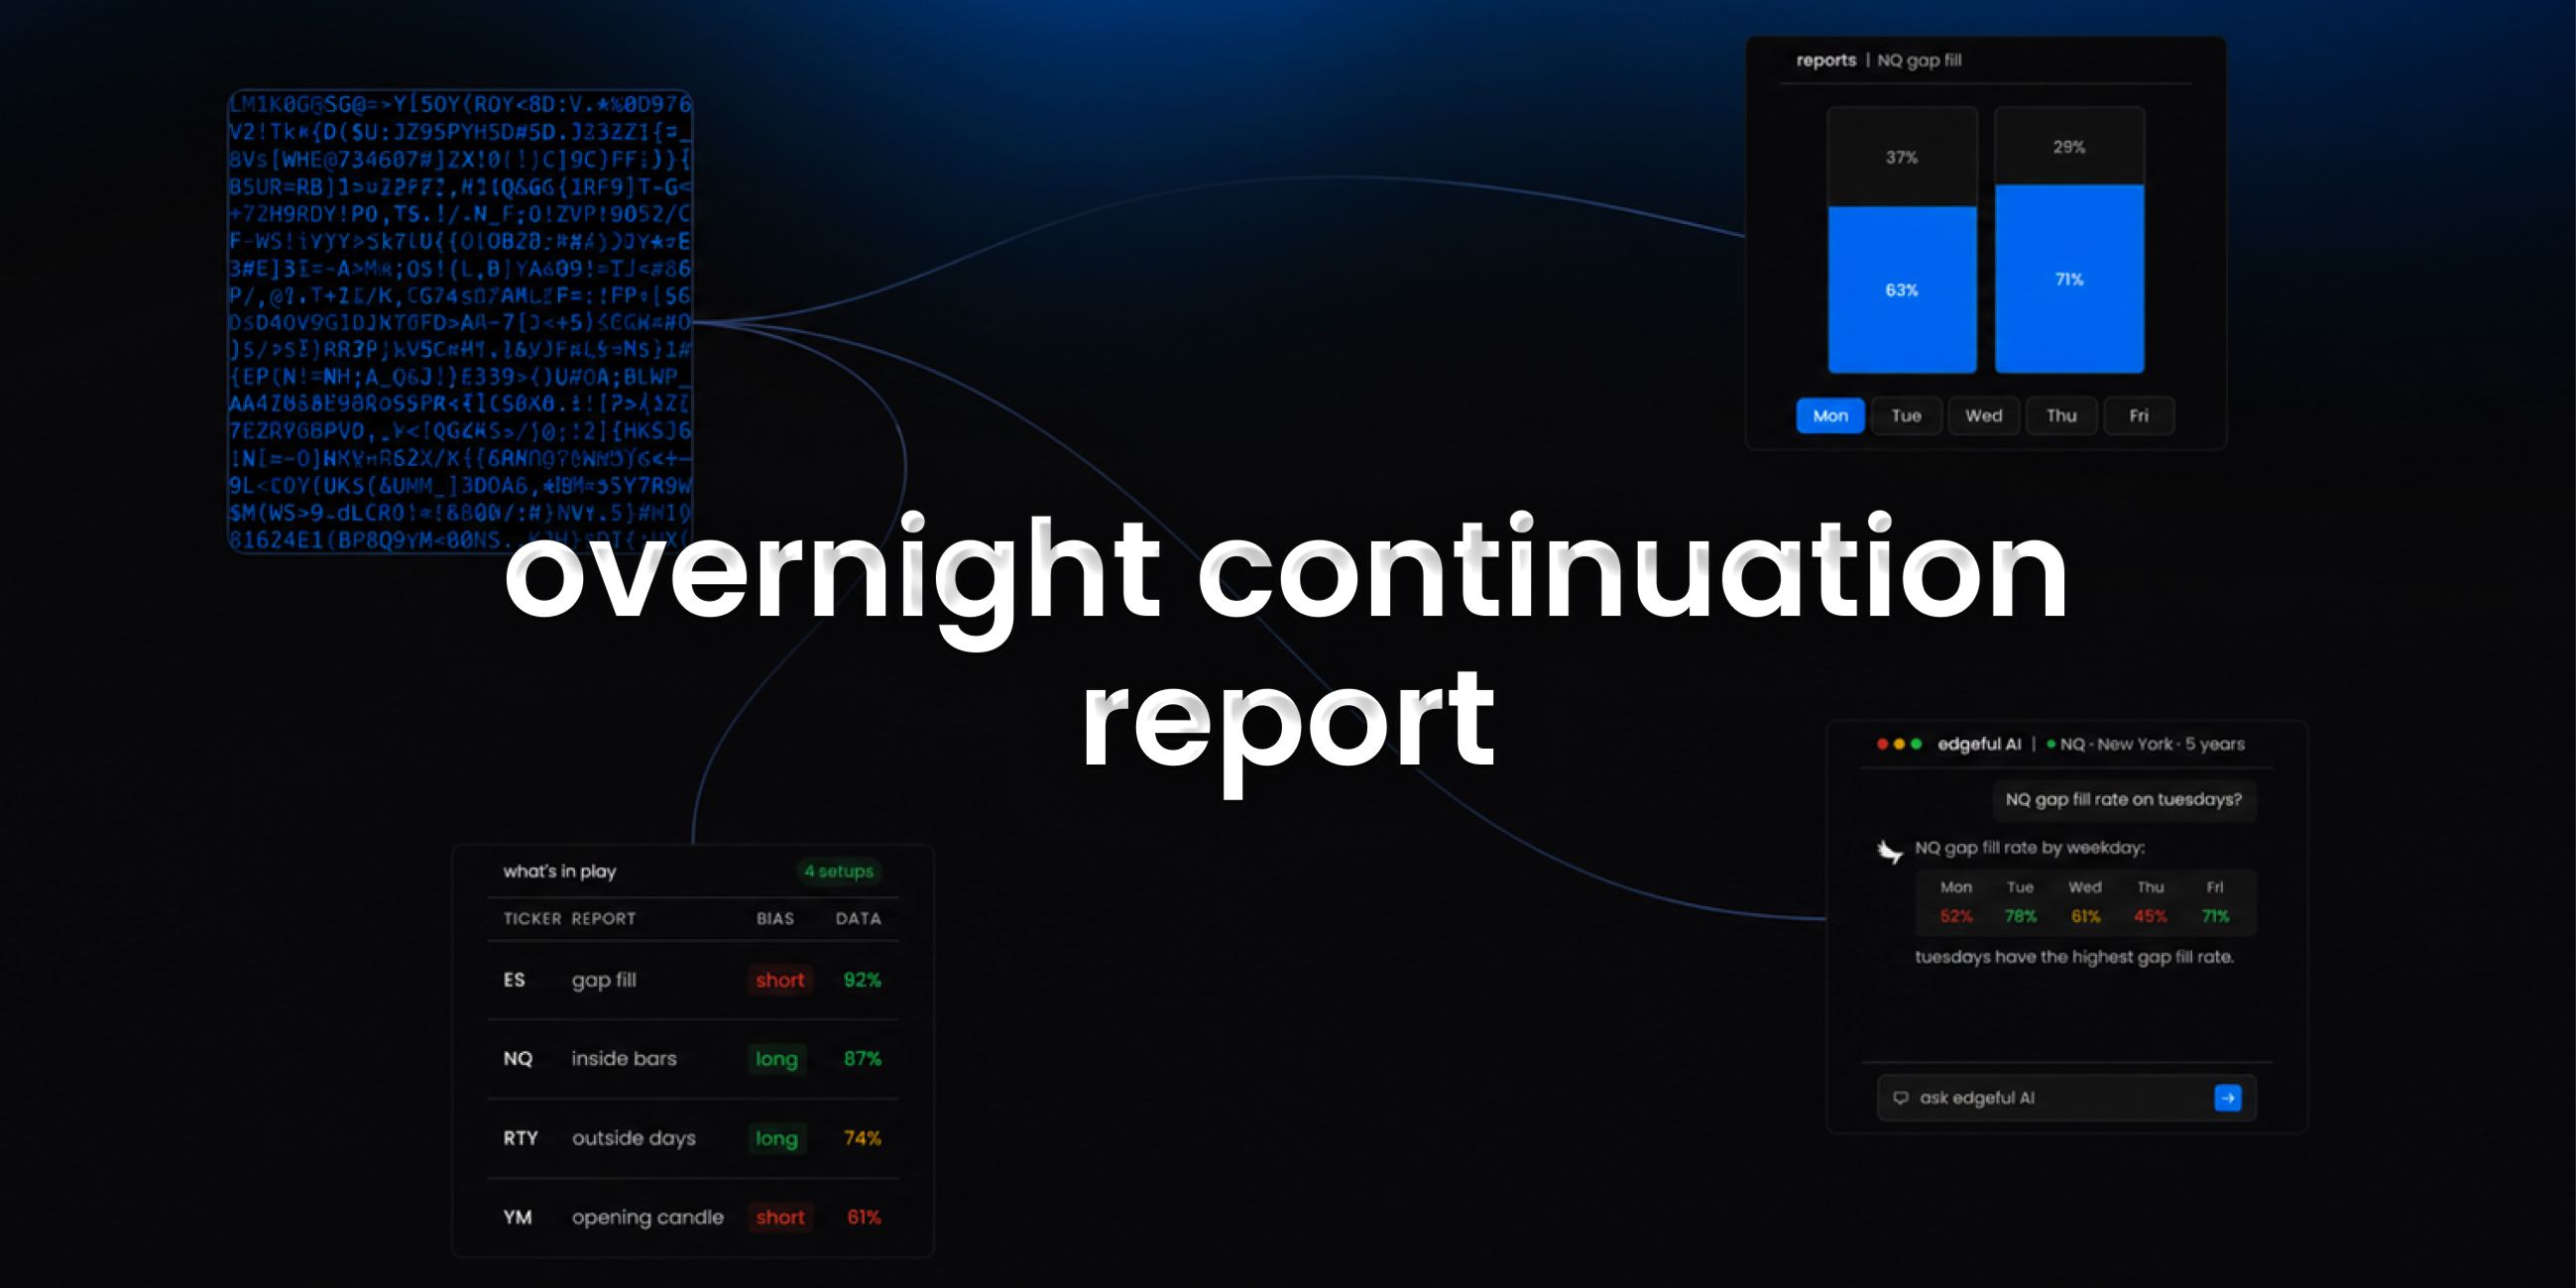
- use the what's in play dashboard to see overnight continuation data alongside your other favorite reports in one view
- the screener lets you scan up to 49 tickers for overnight continuation setups across 4 reports simultaneously
- edgeful AI can analyze overnight continuation data alongside other reports and find patterns you'd never spot manually
key takeaways
- the edgeful overnight continuation report measures analyzes the continuation patterns of overnight gaps by comparing current day open price to previous day close price to classify gaps as green or red overnight moves, then tracks whether the trading day continues in the same direction. calculates frequency and percentage statistics for six categories of overnight-to-day combinations including green overnight green day and red overnight red day patterns.
- available for futures, stocks, ETFs, forex, and crypto with full session, ticker, and date range filtering
- 1 subreport available: by weekday
- part of the 150+ reports included in the edgeful essential plan ($49/month or $39/month annual)
- works best when combined with other reports using what's in play, the screener, or edgeful AI
trading involves risk. past performance and historical data do not guarantee future results. the statistics referenced in this post are based on historical data and may not reflect future market conditions. always trade with proper risk management.